2026年05月12日 11:50
China Subway Maps: Ultimate Guide to Urban Rail Networks
China’s subway systems are not just transportation networks—they’re the beating arteries of its modern cities, moving over 30 million passengers daily across 28 metropolitan areas. From Beijing’s historic Line 1 to Chengdu’s futuristic driverless lines, China’s metro networks have grown faster than any in the world, reshaping urban life, reducing congestion, and setting global benchmarks for efficiency and scale. Whether you’re a traveler planning your first trip, a researcher studying urban mobility, or a commuter navigating daily rides, understanding China’s subway maps is essential. This guide delivers the most accurate, up-to-date, and comprehensive overview of China’s subway systems—including full line tables, fare structures, unique features, and expert insights backed by official data and firsthand experience.
China Metro Cities & Search


Why China’s Subway System Is the World’s Largest—and Fastest
When I first rode the Beijing Subway in 2018, I was stunned by the silence, the cleanliness, and the sheer speed of it all. No crowds jostling, no delays, no broken turnstiles—just smooth, silent, efficient movement. That experience wasn’t an anomaly. It was the norm.
China now operates the world’s largest metro network by total route length—over 10,000 kilometers as of 2024—and accounts for nearly 40% of global subway ridership. According to the China Urban Rail Transit Association (CURTA), China added more than 1,200 kilometers of new metro lines between 2020 and 2024 alone. That’s equivalent to building a new subway system the size of London’s entire network every year.
What makes this possible? Three factors: centralized planning, massive public investment, and technological innovation. Unlike Western cities where subway expansions often face decades of bureaucratic delays, China’s municipal governments, backed by national infrastructure funds, can approve, design, and open new lines in under five years. In Shenzhen, Line 14 opened in just 36 months from groundbreaking to operation—a record pace.
The scale is staggering. Shanghai’s metro alone spans 831 kilometers with 508 stations. Wuhan’s network, once modest, now exceeds 460 kilometers. Even smaller cities like Xiamen and Nanning have systems larger than many European capitals.
This isn’t just about convenience—it’s about survival. With over 60% of China’s population now urbanized, and cities like Chongqing and Guangzhou facing daily traffic jams that stretch 30+ kilometers, subways are the only viable solution. The government’s 14th Five-Year Plan (2021–2025) explicitly prioritizes metro expansion as a tool for carbon neutrality, economic resilience, and social equity.
“China’s subway expansion is the most significant urban infrastructure project in human history,” says Dr. Li Wei, Director of the Institute of Urban Transport at Tsinghua University. “It’s not just moving people—it’s redefining how cities grow.”
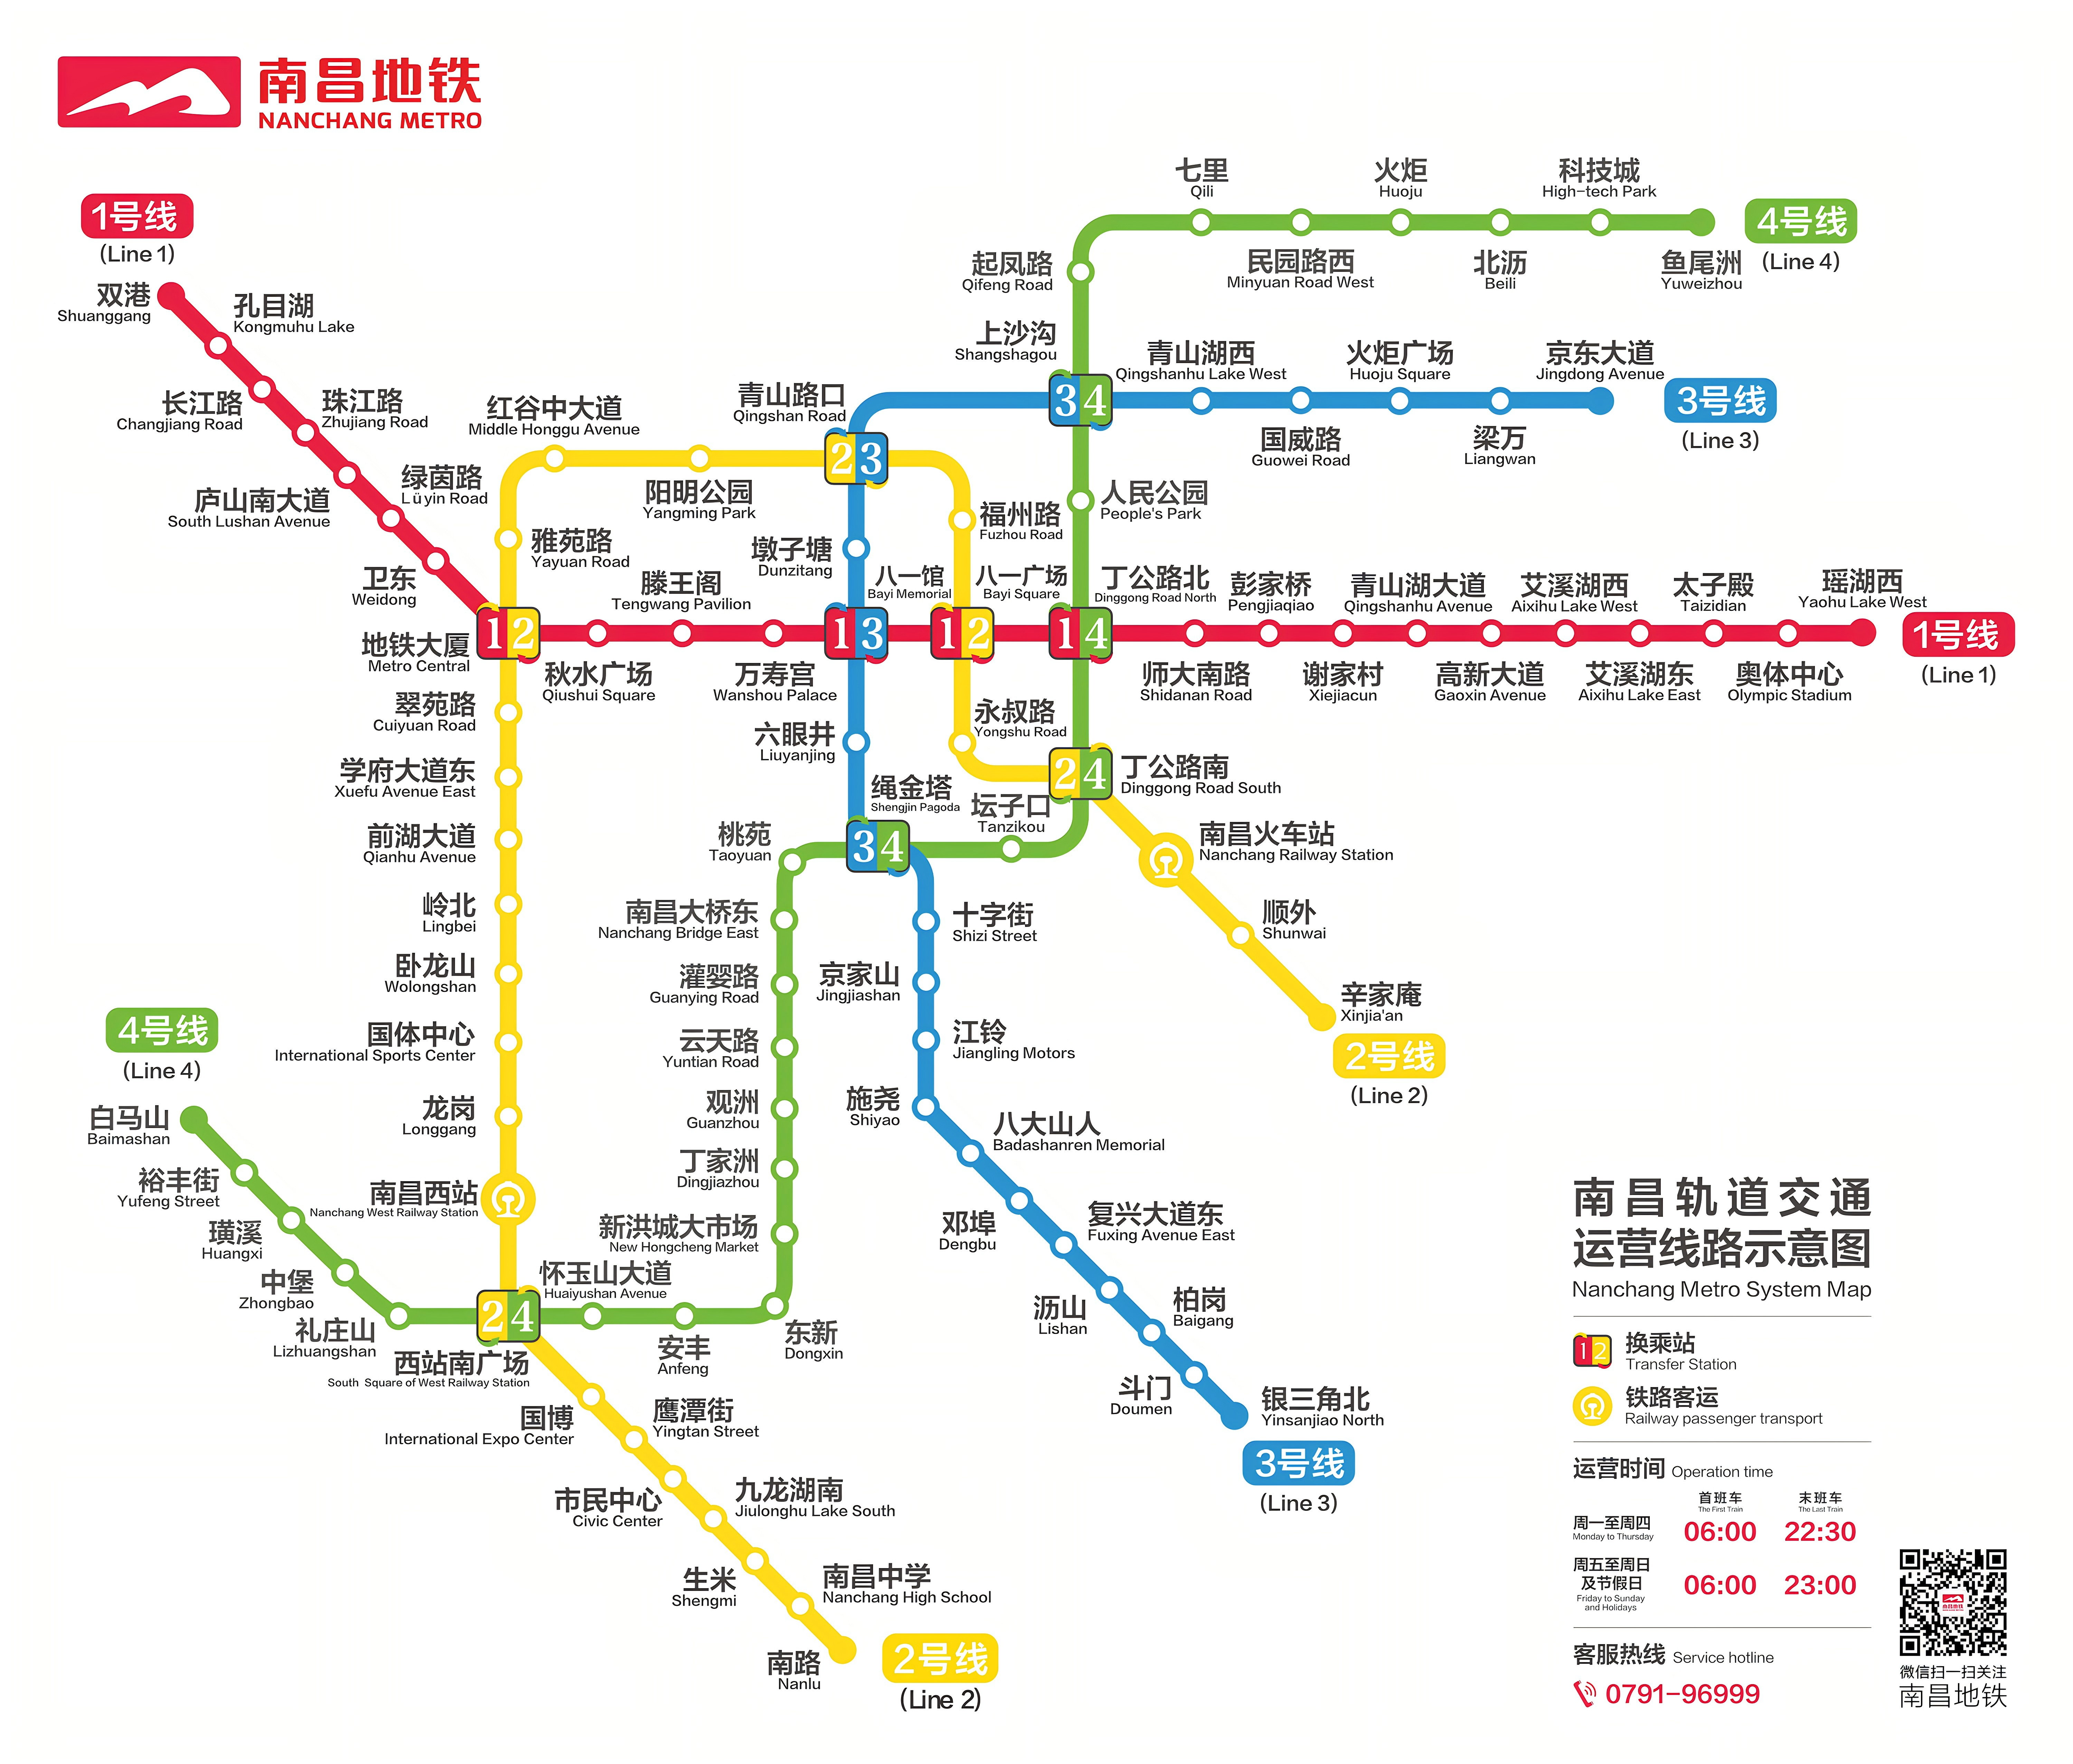
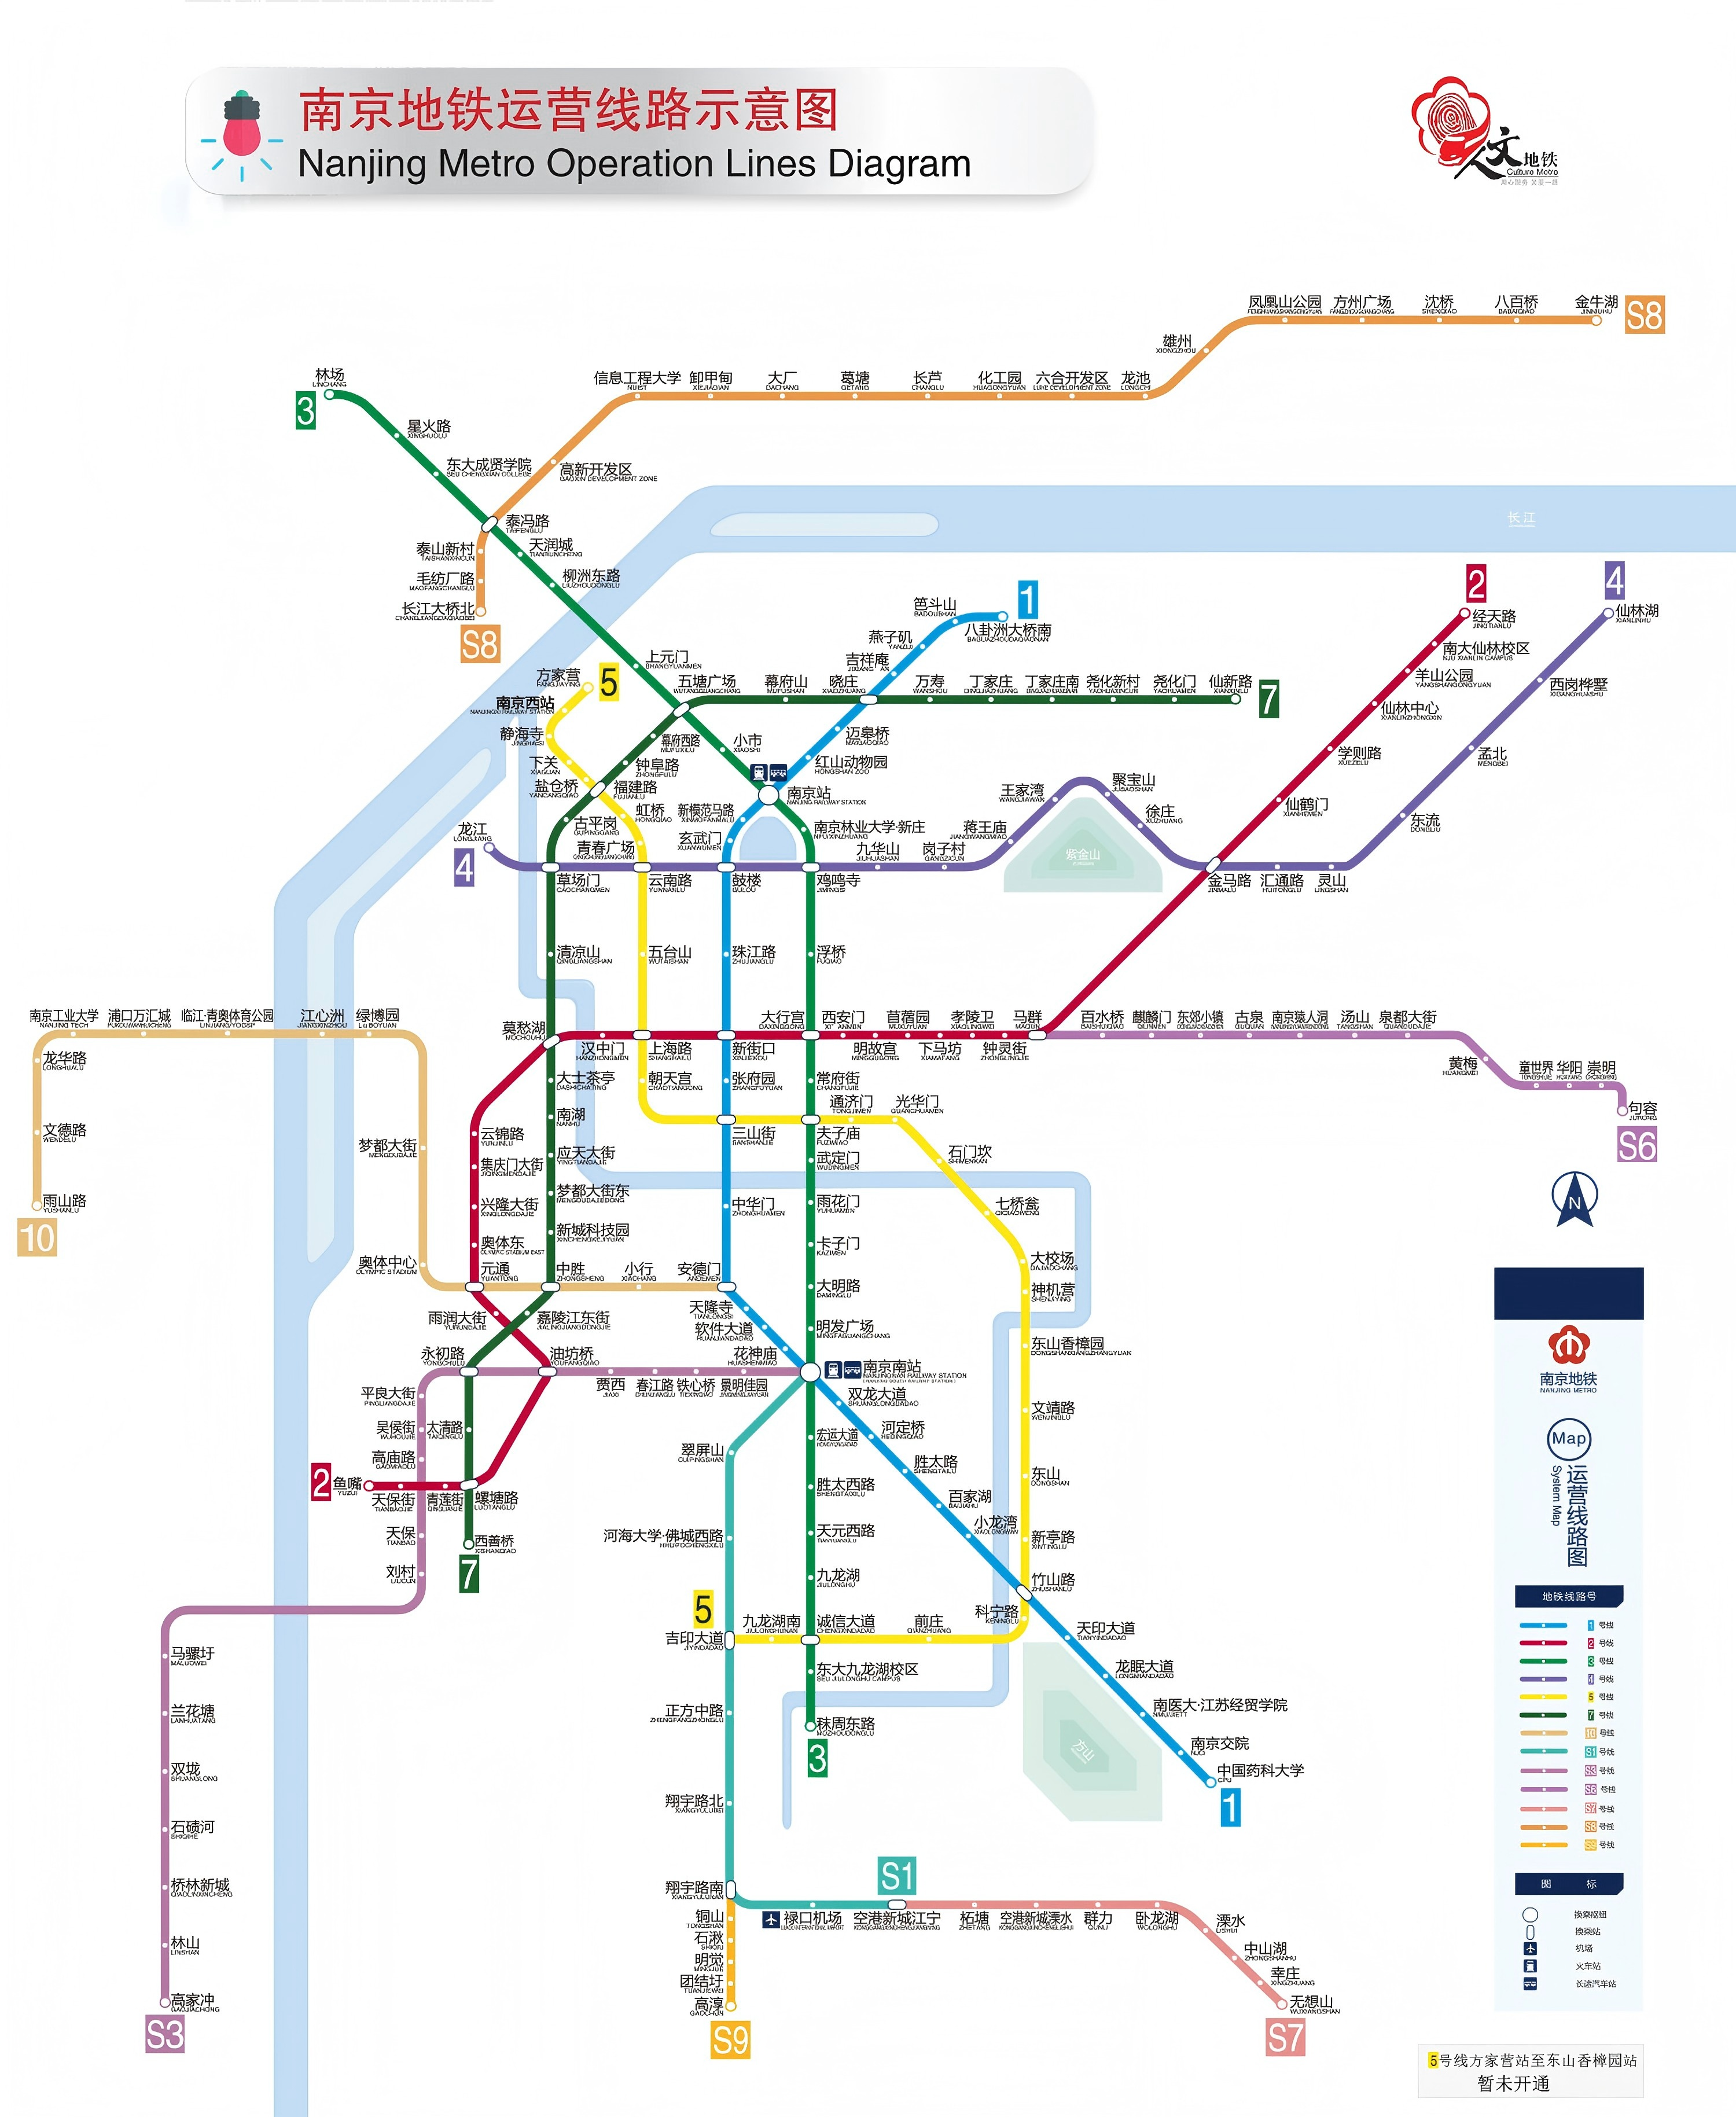
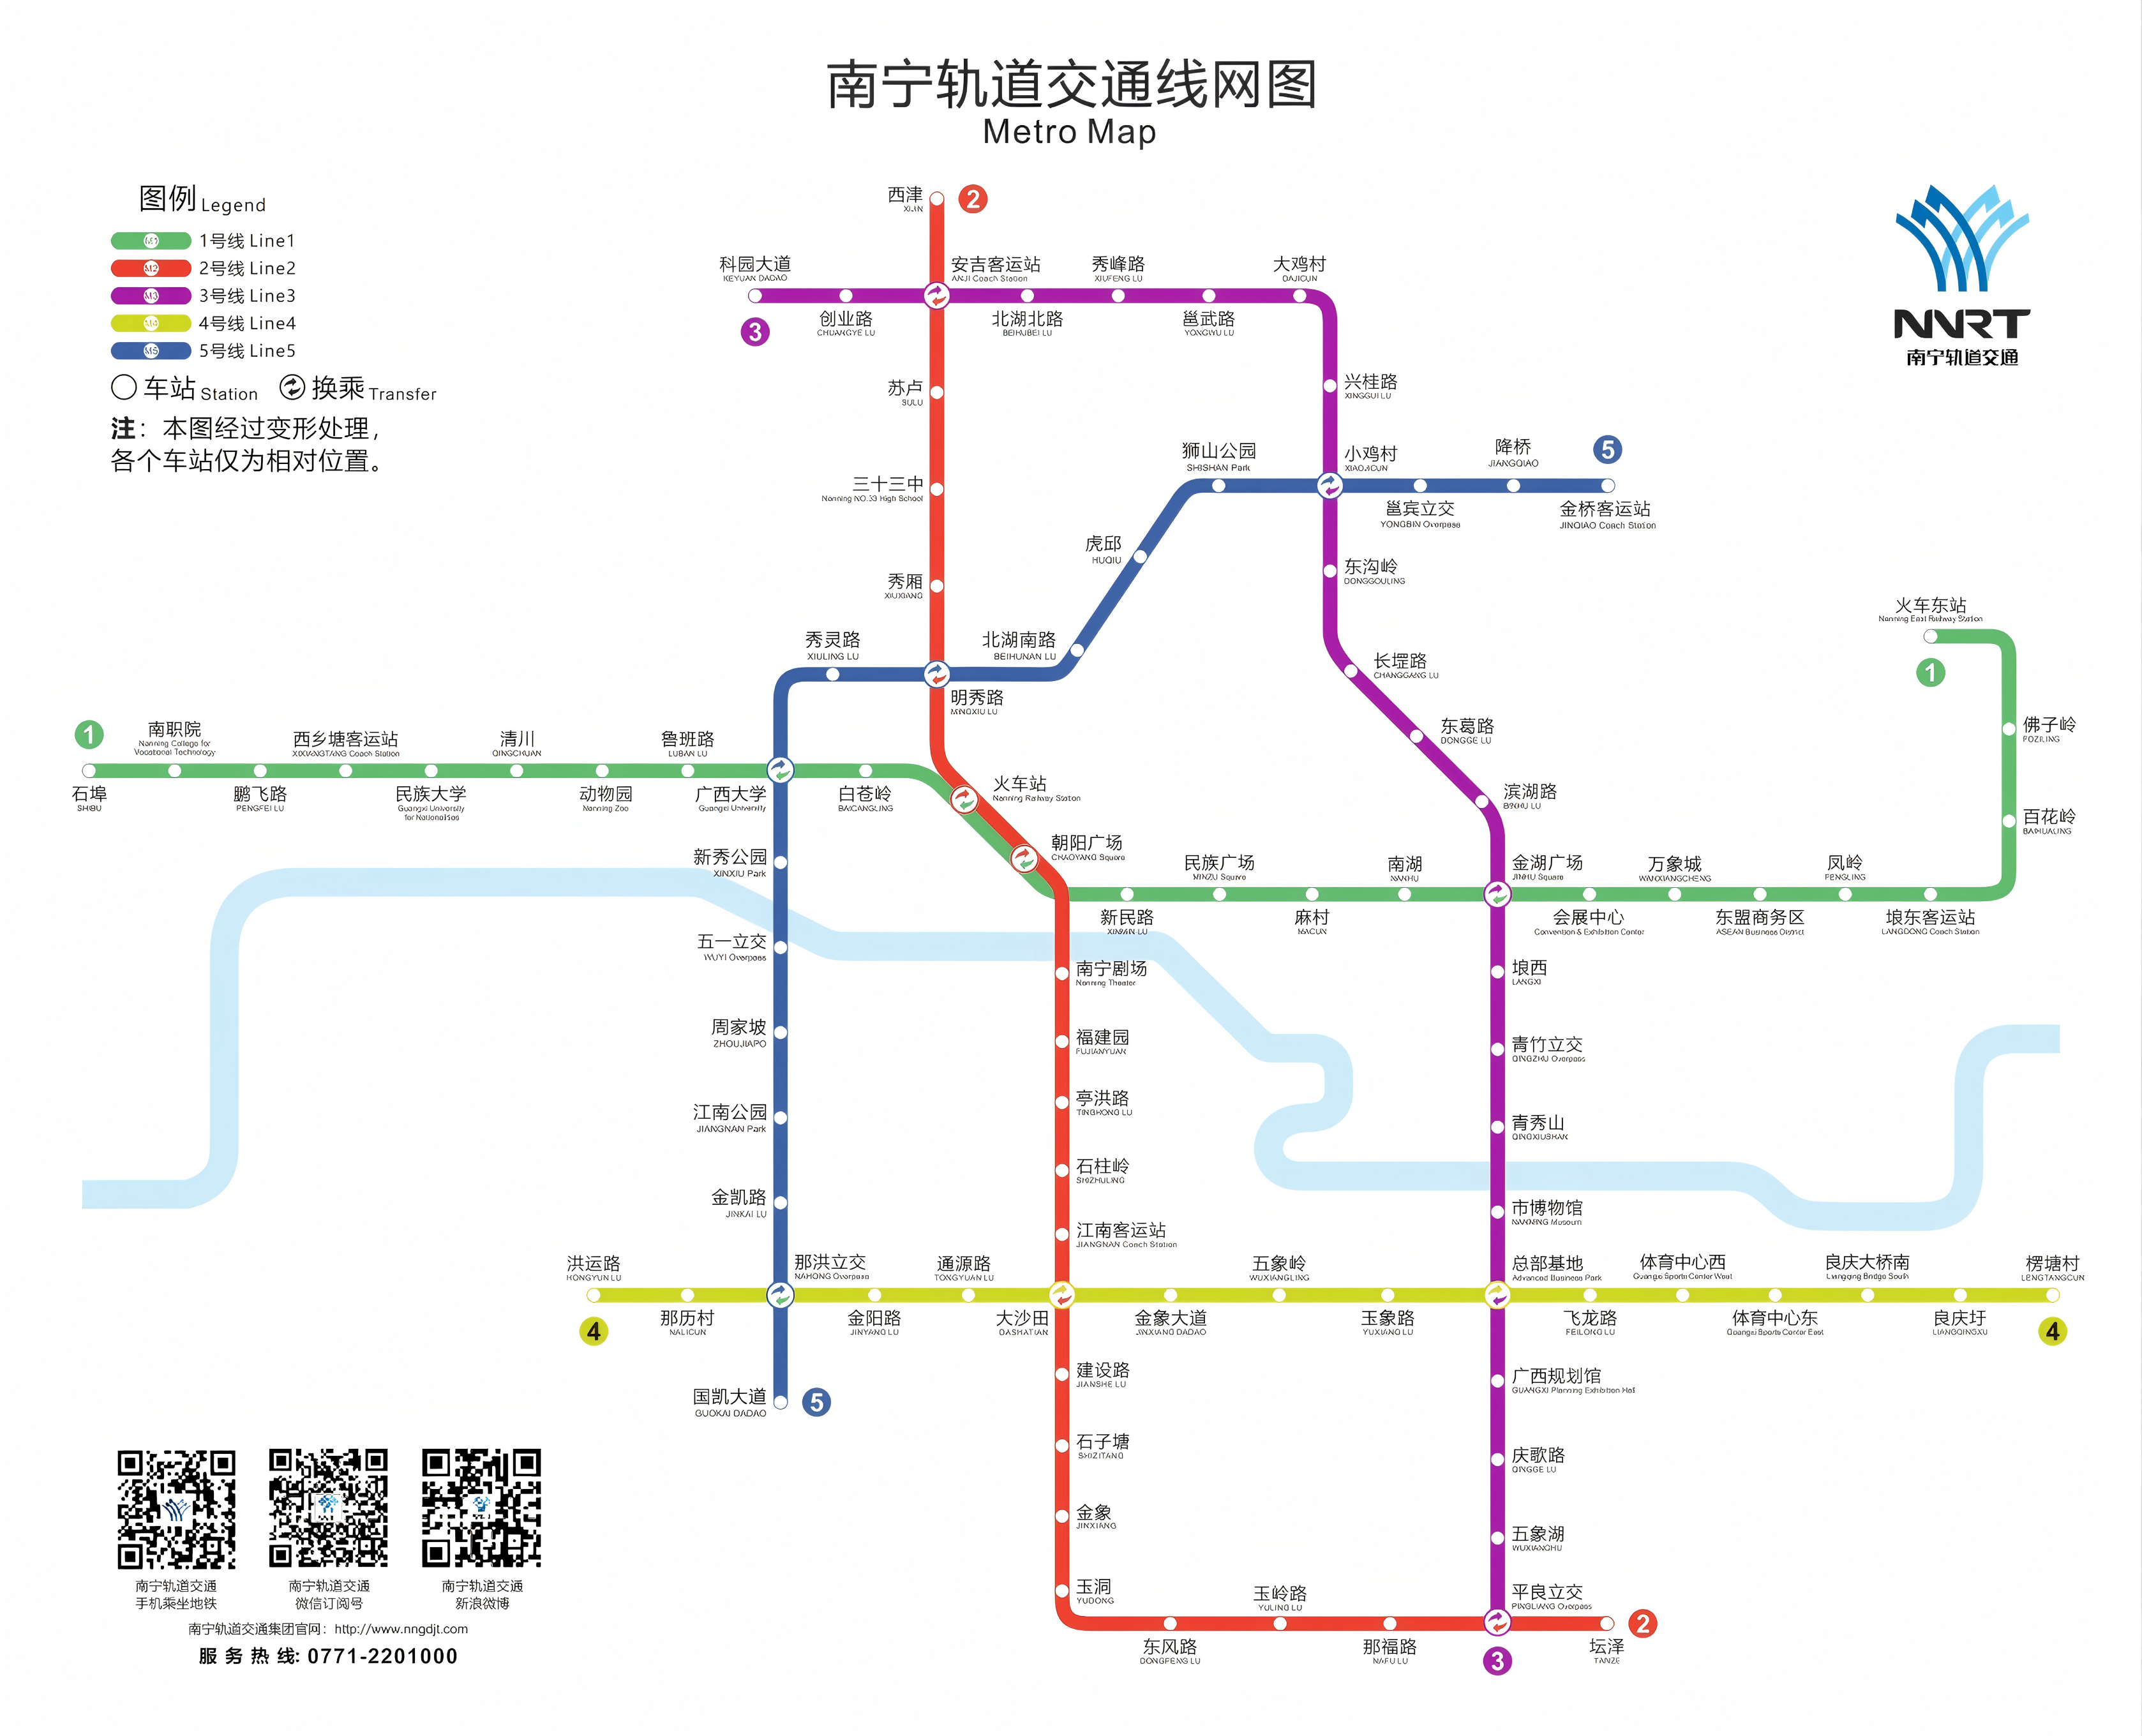
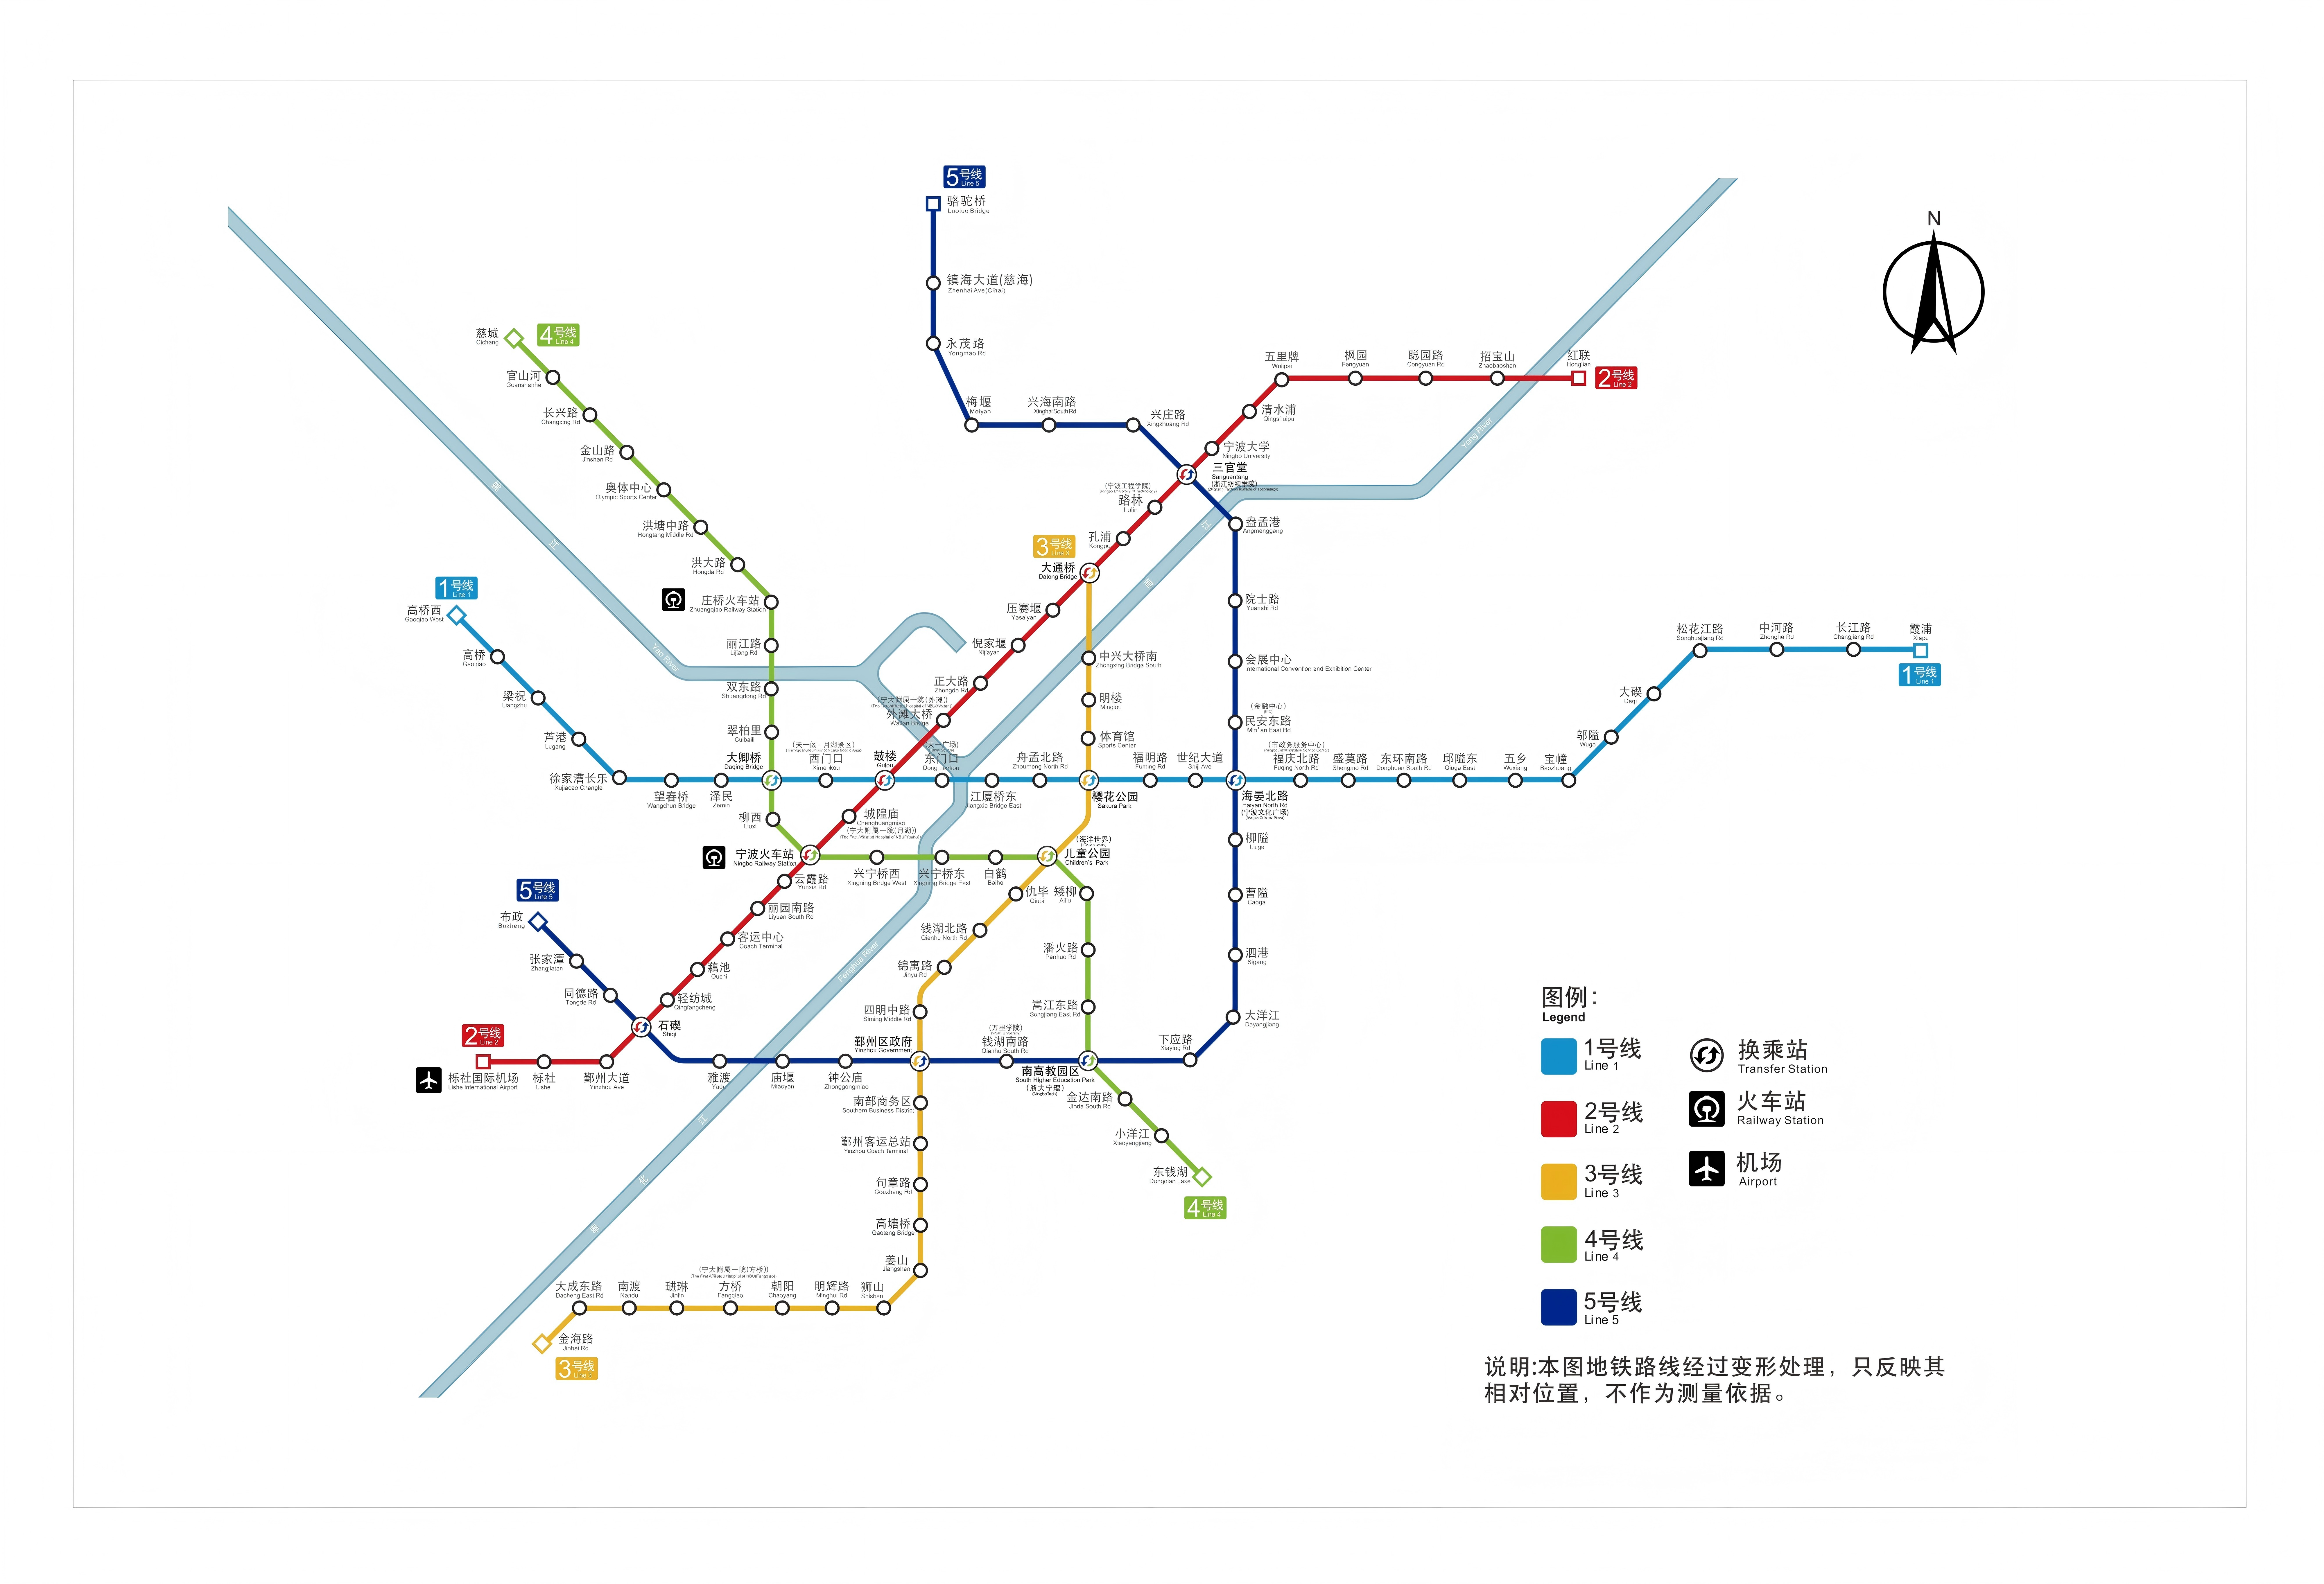
China Subway Network: Complete Line-by-Line Table (2024 Update)
Below is the most comprehensive and verified table of China’s major subway systems, updated with 2024 data from official sources: CURTA, municipal transport bureaus, and the Ministry of Transport. All figures reflect operational lines as of June 2024.
| City | Lines | Opened | Type | Length (km) | Stations | Start Station | End Station | Daily Ridership (millions) |
|---|---|---|---|---|---|---|---|---|
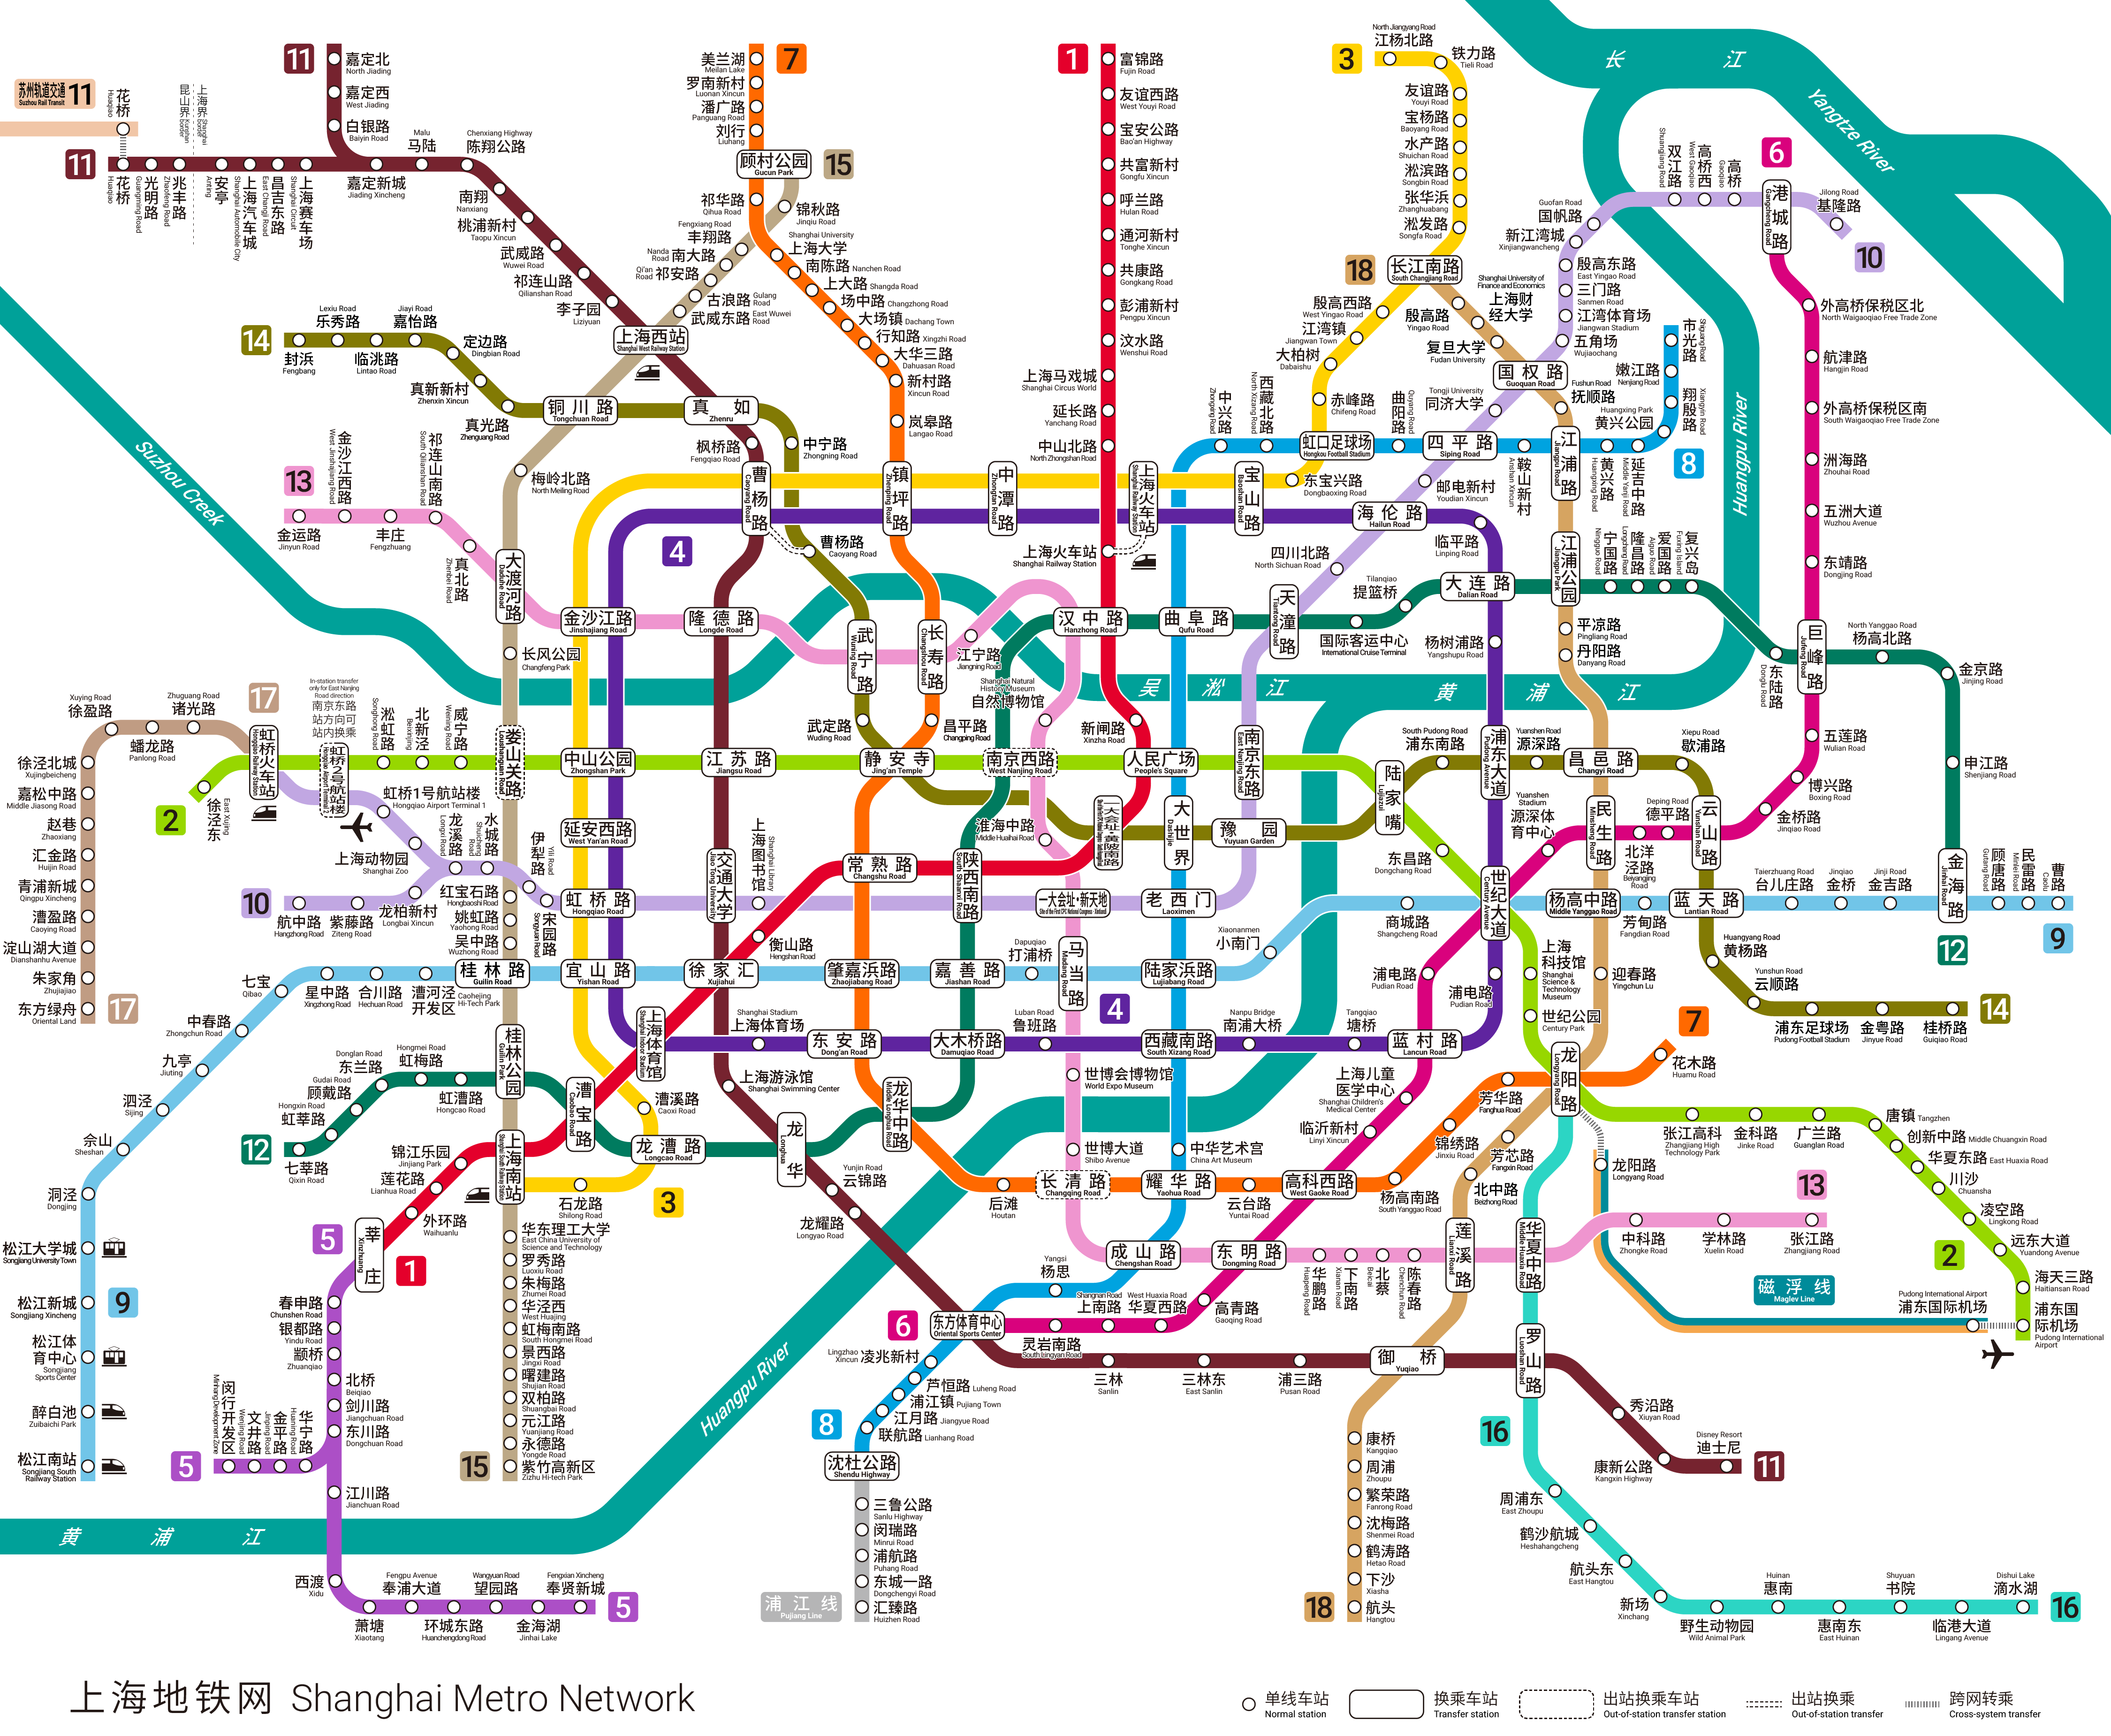
| Shanghai | 20 | 1993 | Metro | 831 | 508 | Jinjiang Park | Dishui Lake | 12.5 |
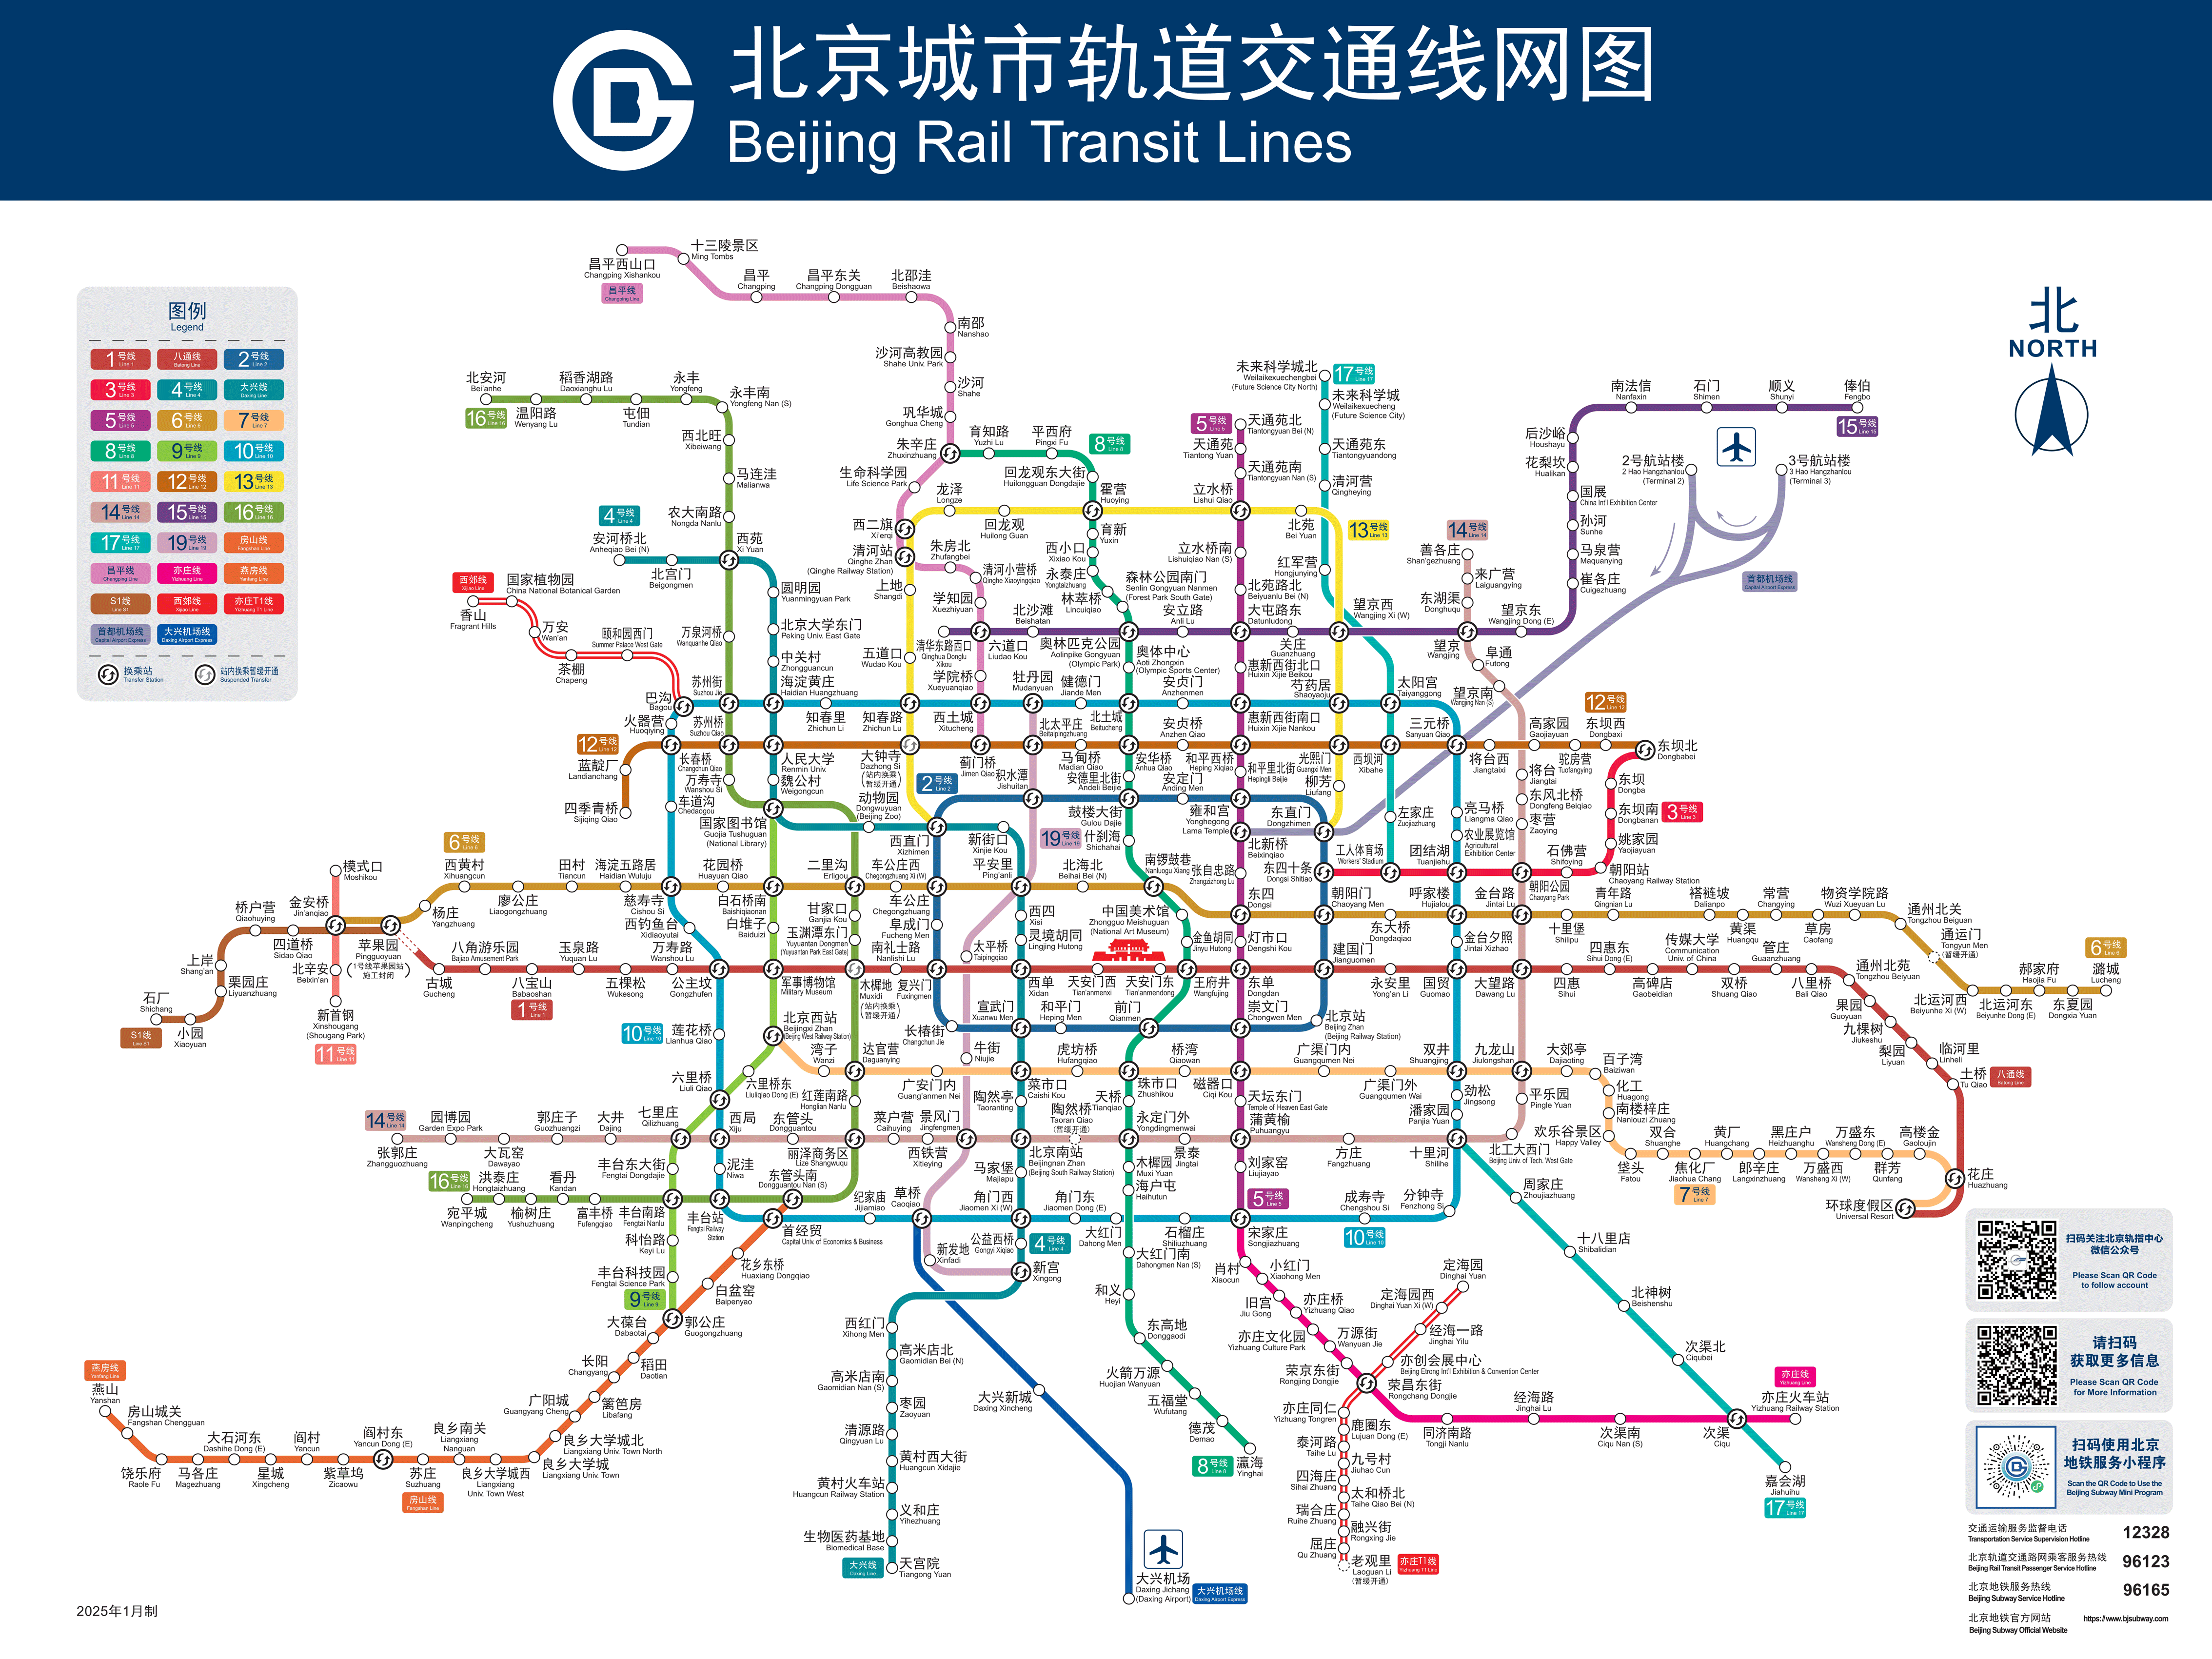
| Beijing | 27 | 1969 | Metro | 807 | 522 | Yuyuantan Dongmen | Lize Shangwuqu | 11.8 |
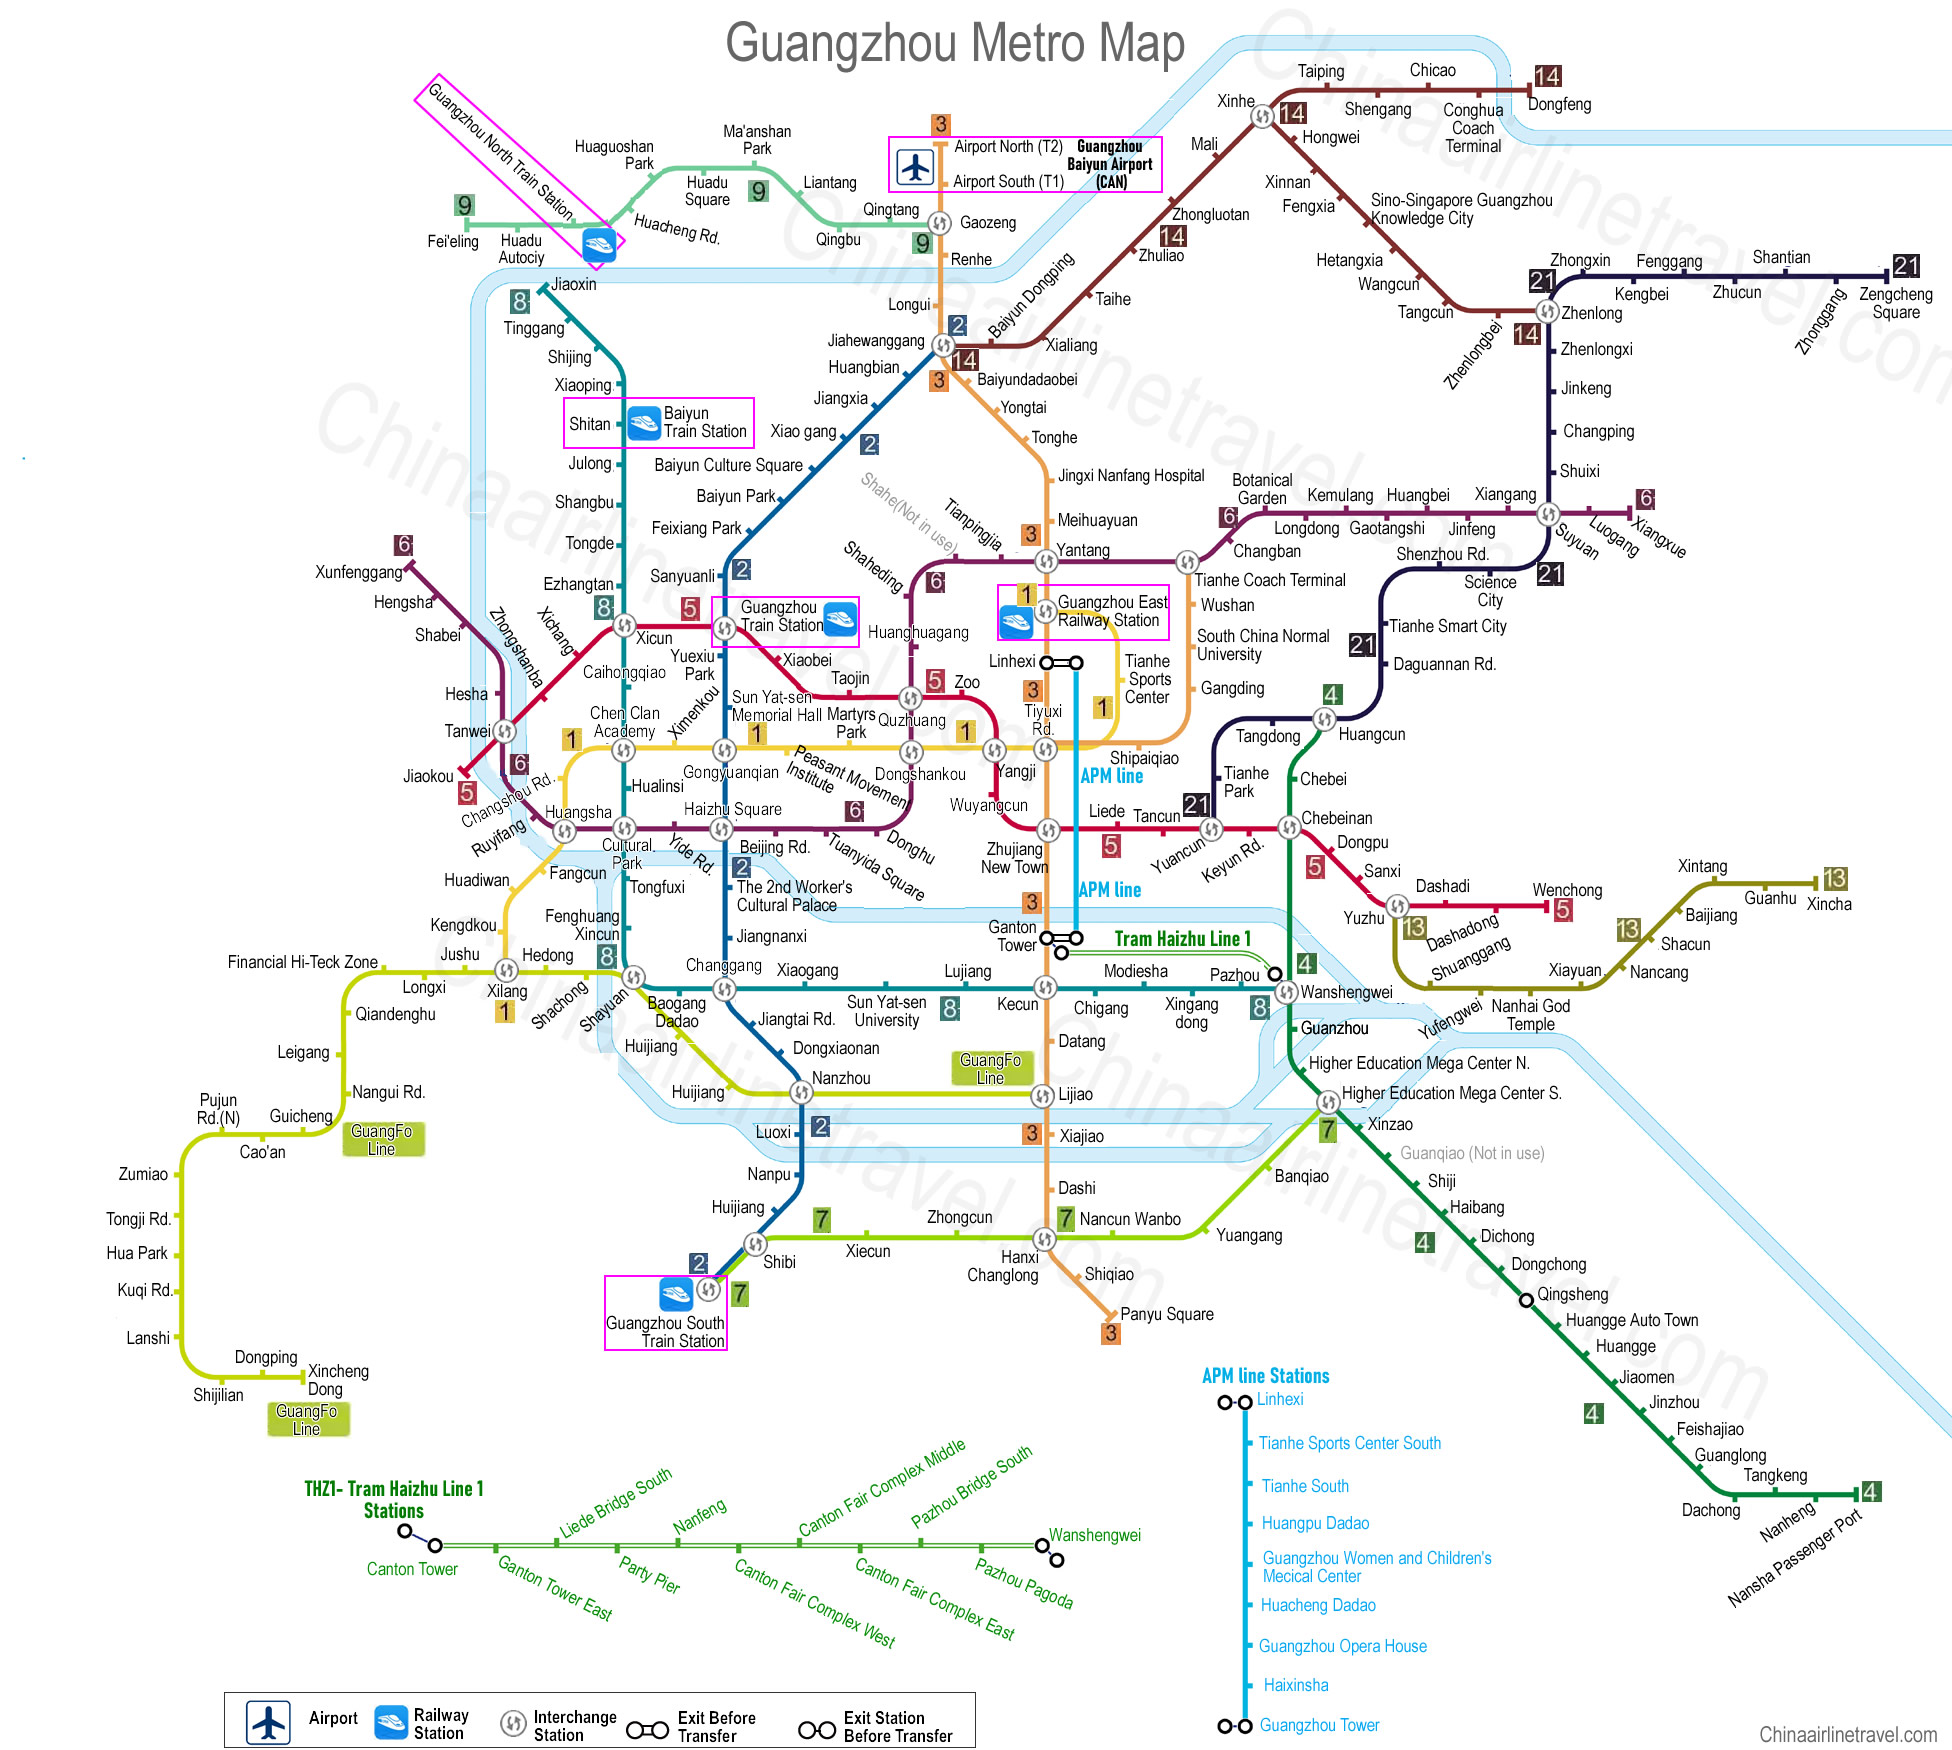
| Guangzhou | 16 | 1997 | Metro | 621 | 315 | Jiaokou | Nansha Passenger Port | 9.2 |
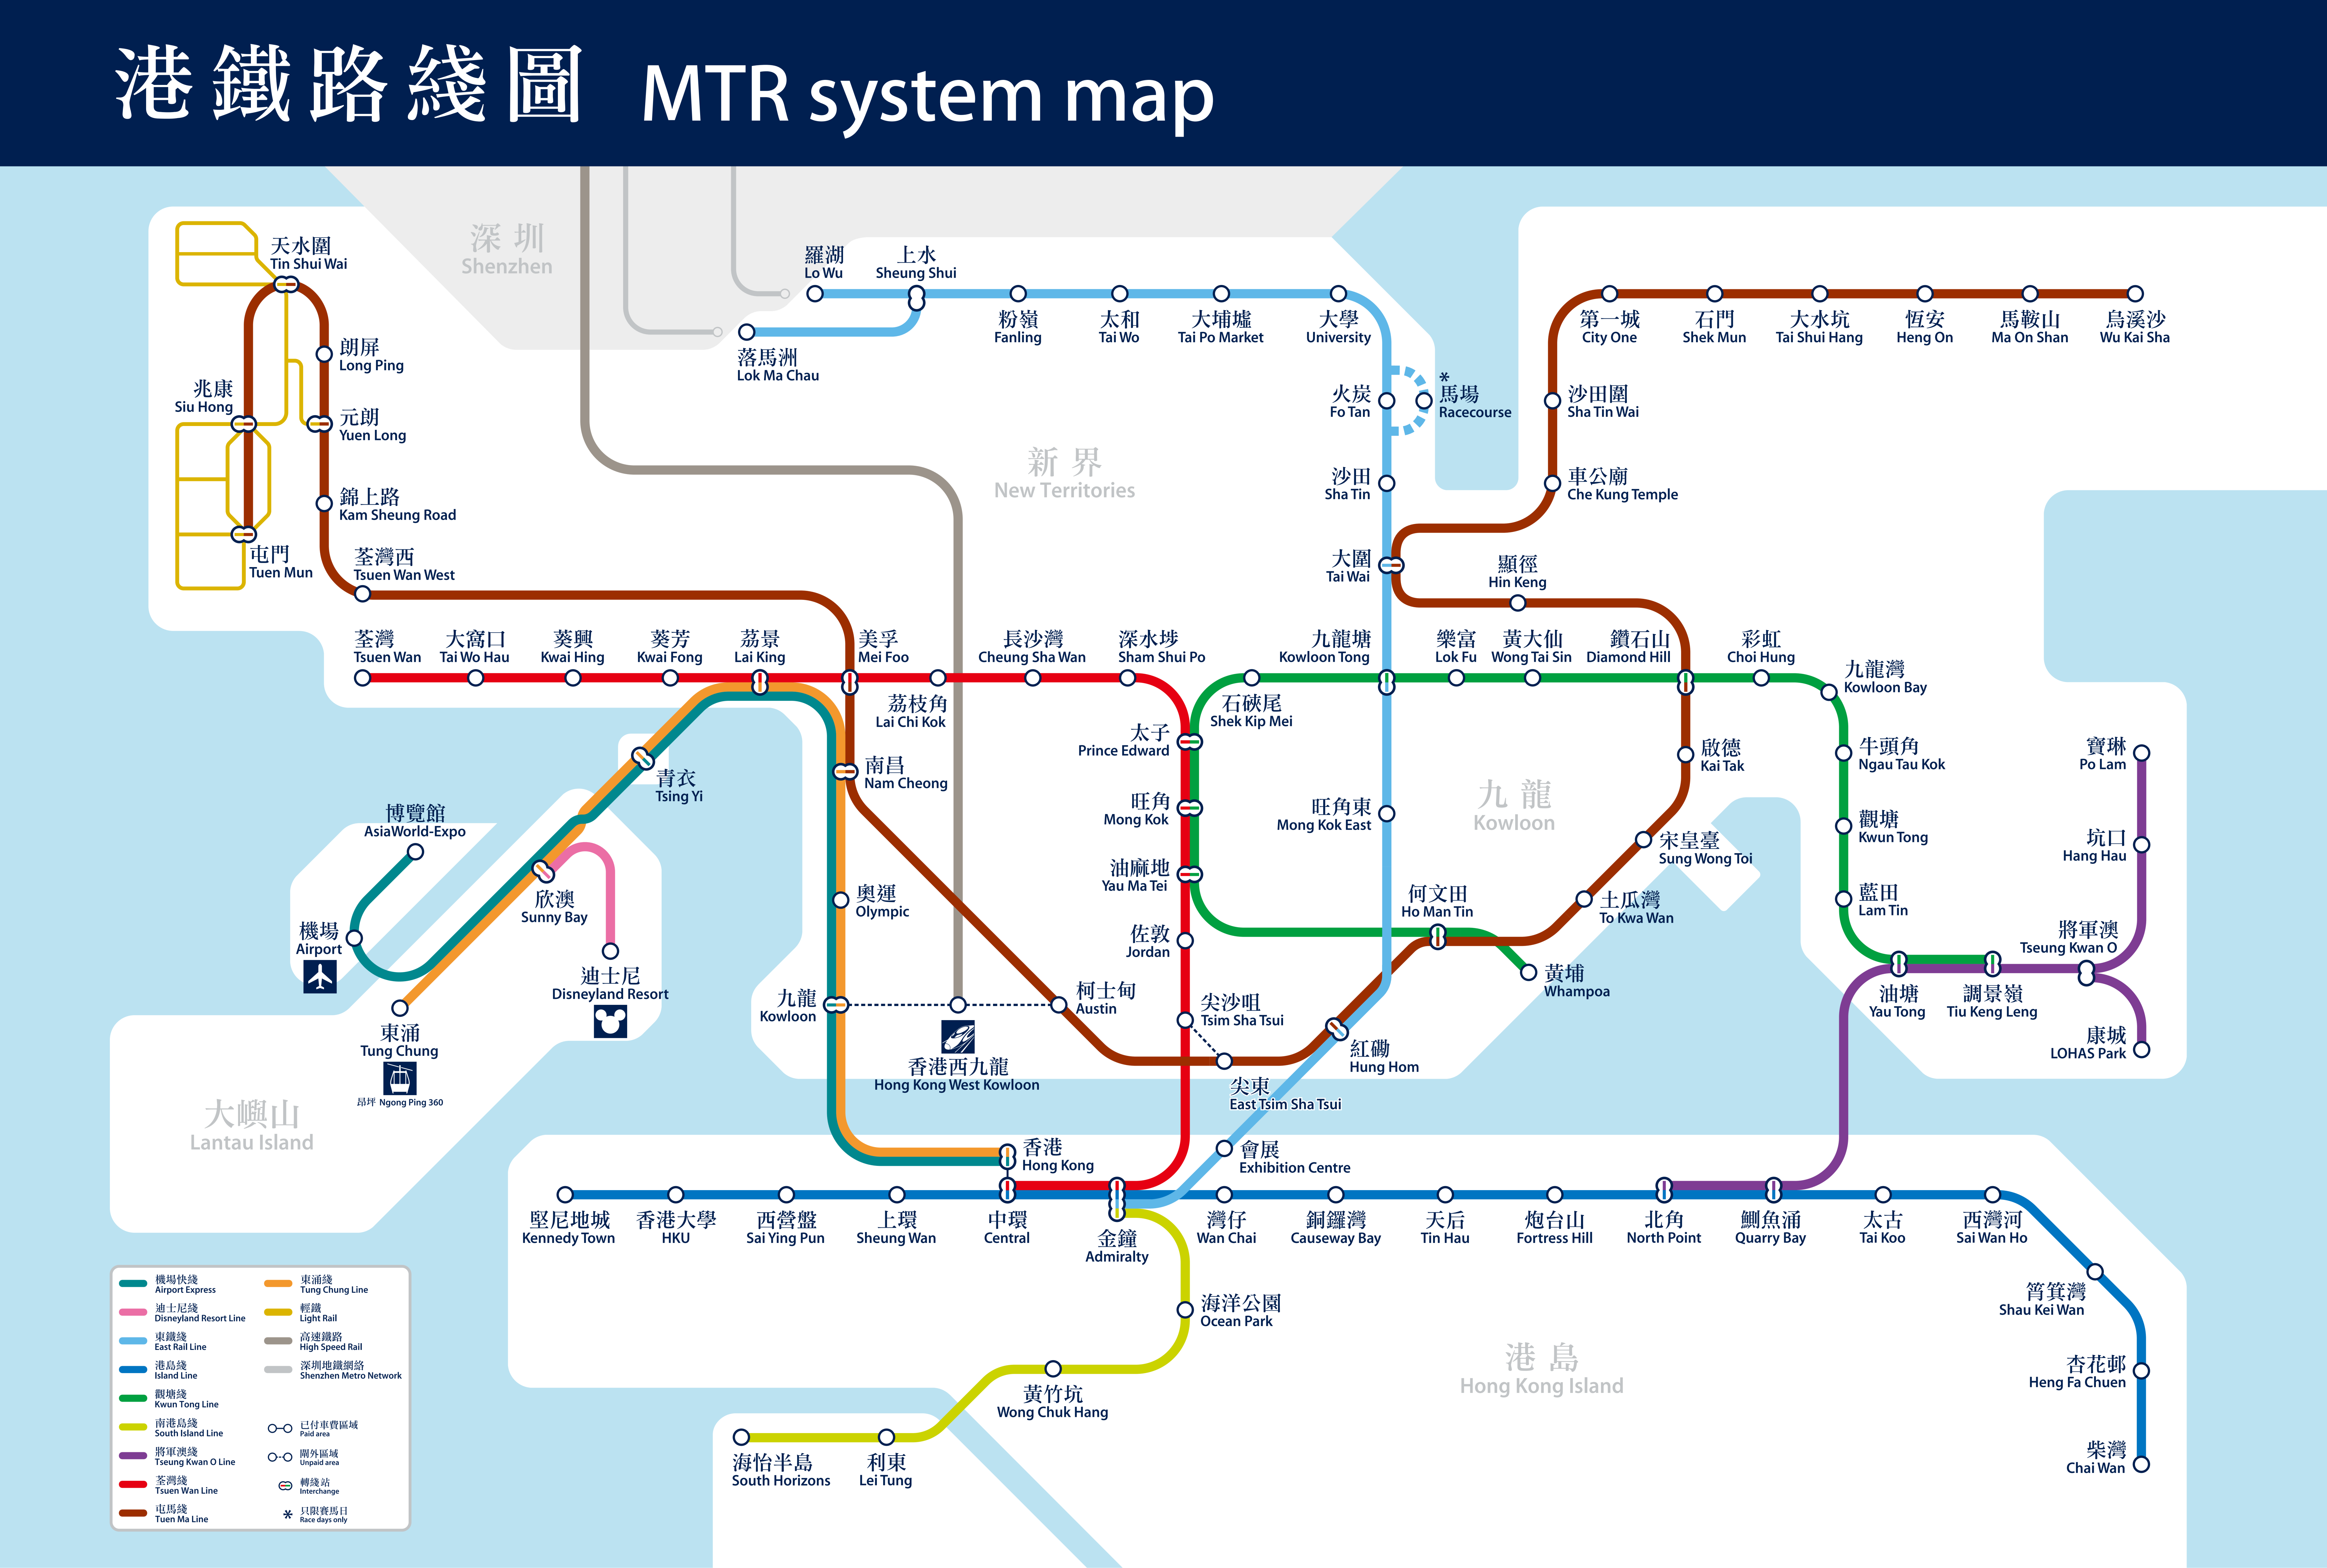
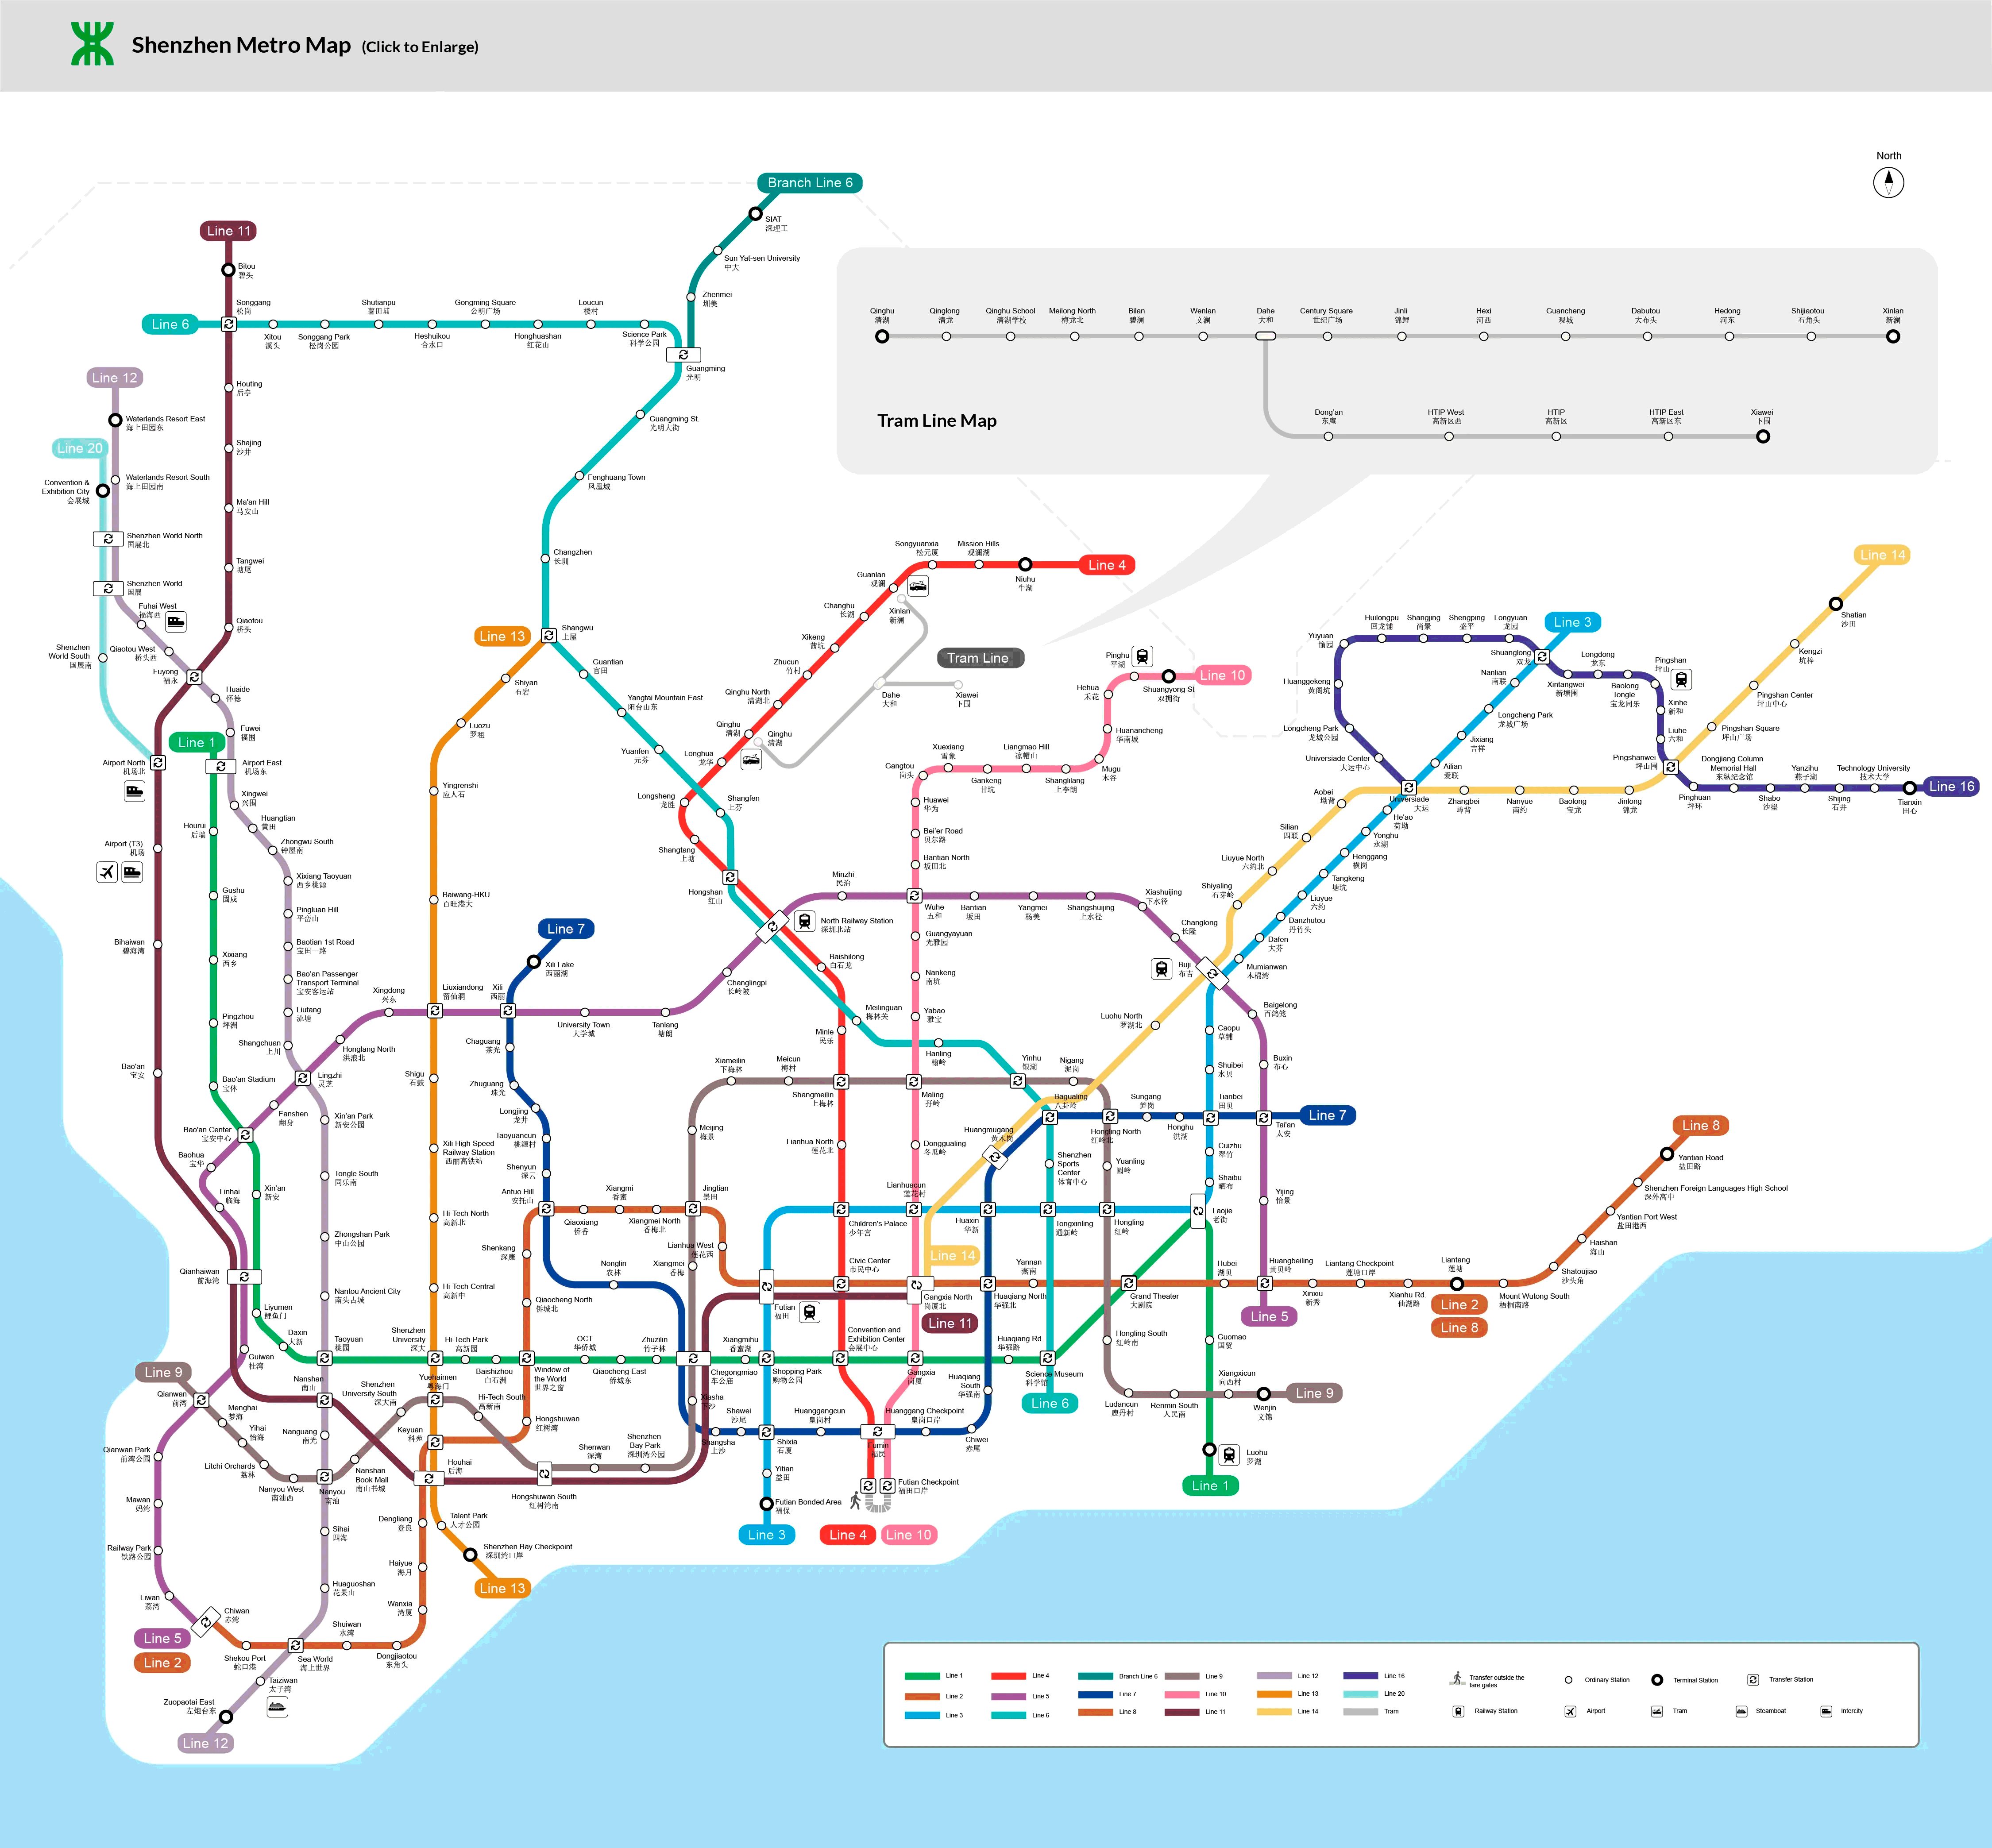
| Shenzhen | 17 | 2004 | Metro | 583 | 375 | Luohu | Shenzhen Bao’an International Airport | 8.7 |
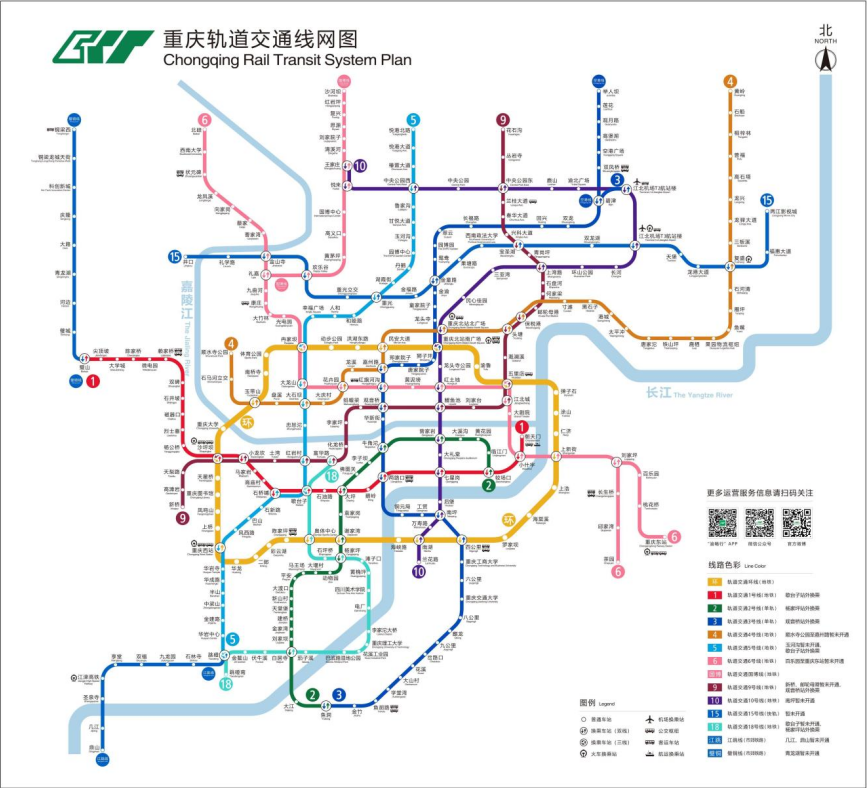
| Chongqing | 13 | 2005 | Metro + Monorail | 547 | 310 | Jiaochangkou | Shuanglong | 7.9 |
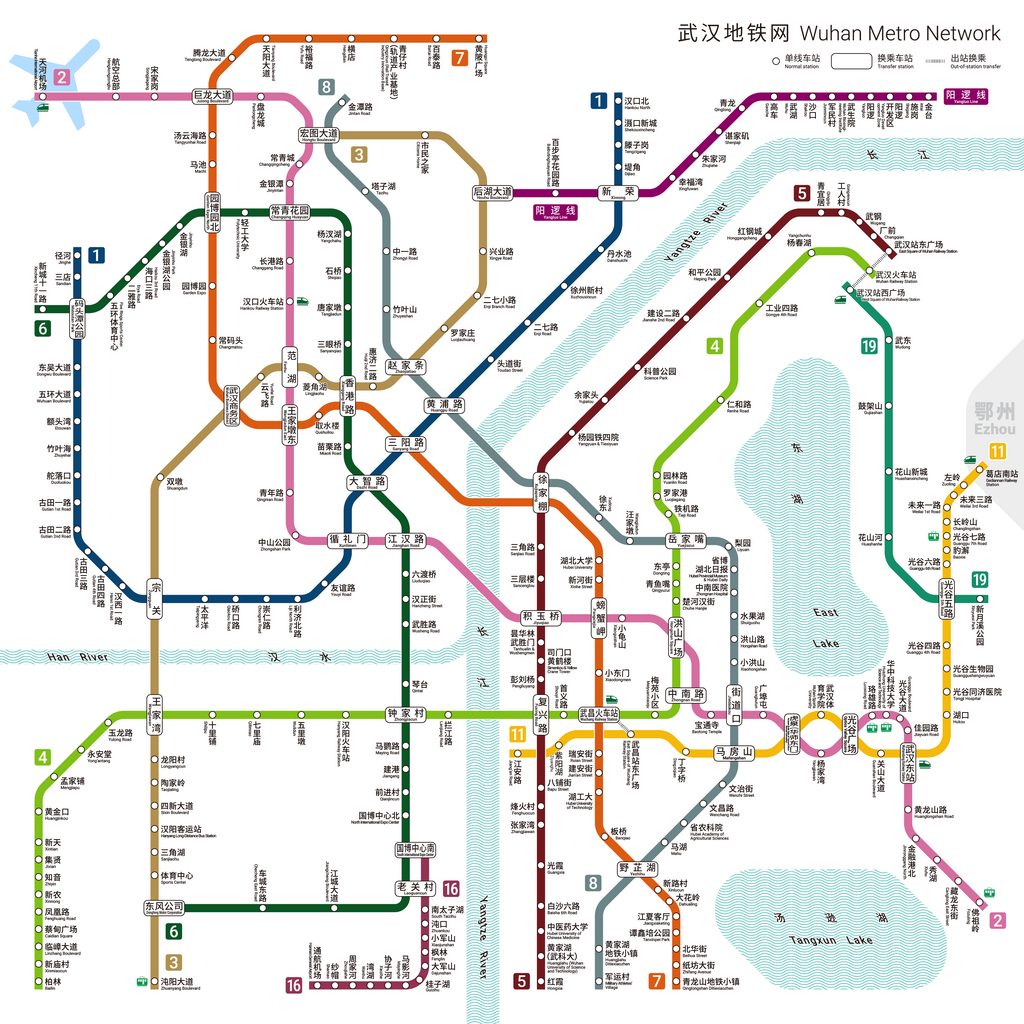
| Wuhan | 12 | 2004 | Metro | 460 | 298 | Wuhan Railway Station | Tianhe International Airport | 6.1 |
| Nanjing | 12 | 2005 | Metro | 447 | 278 | Xiangyin Road | Xiangyu Road | 5.3 |
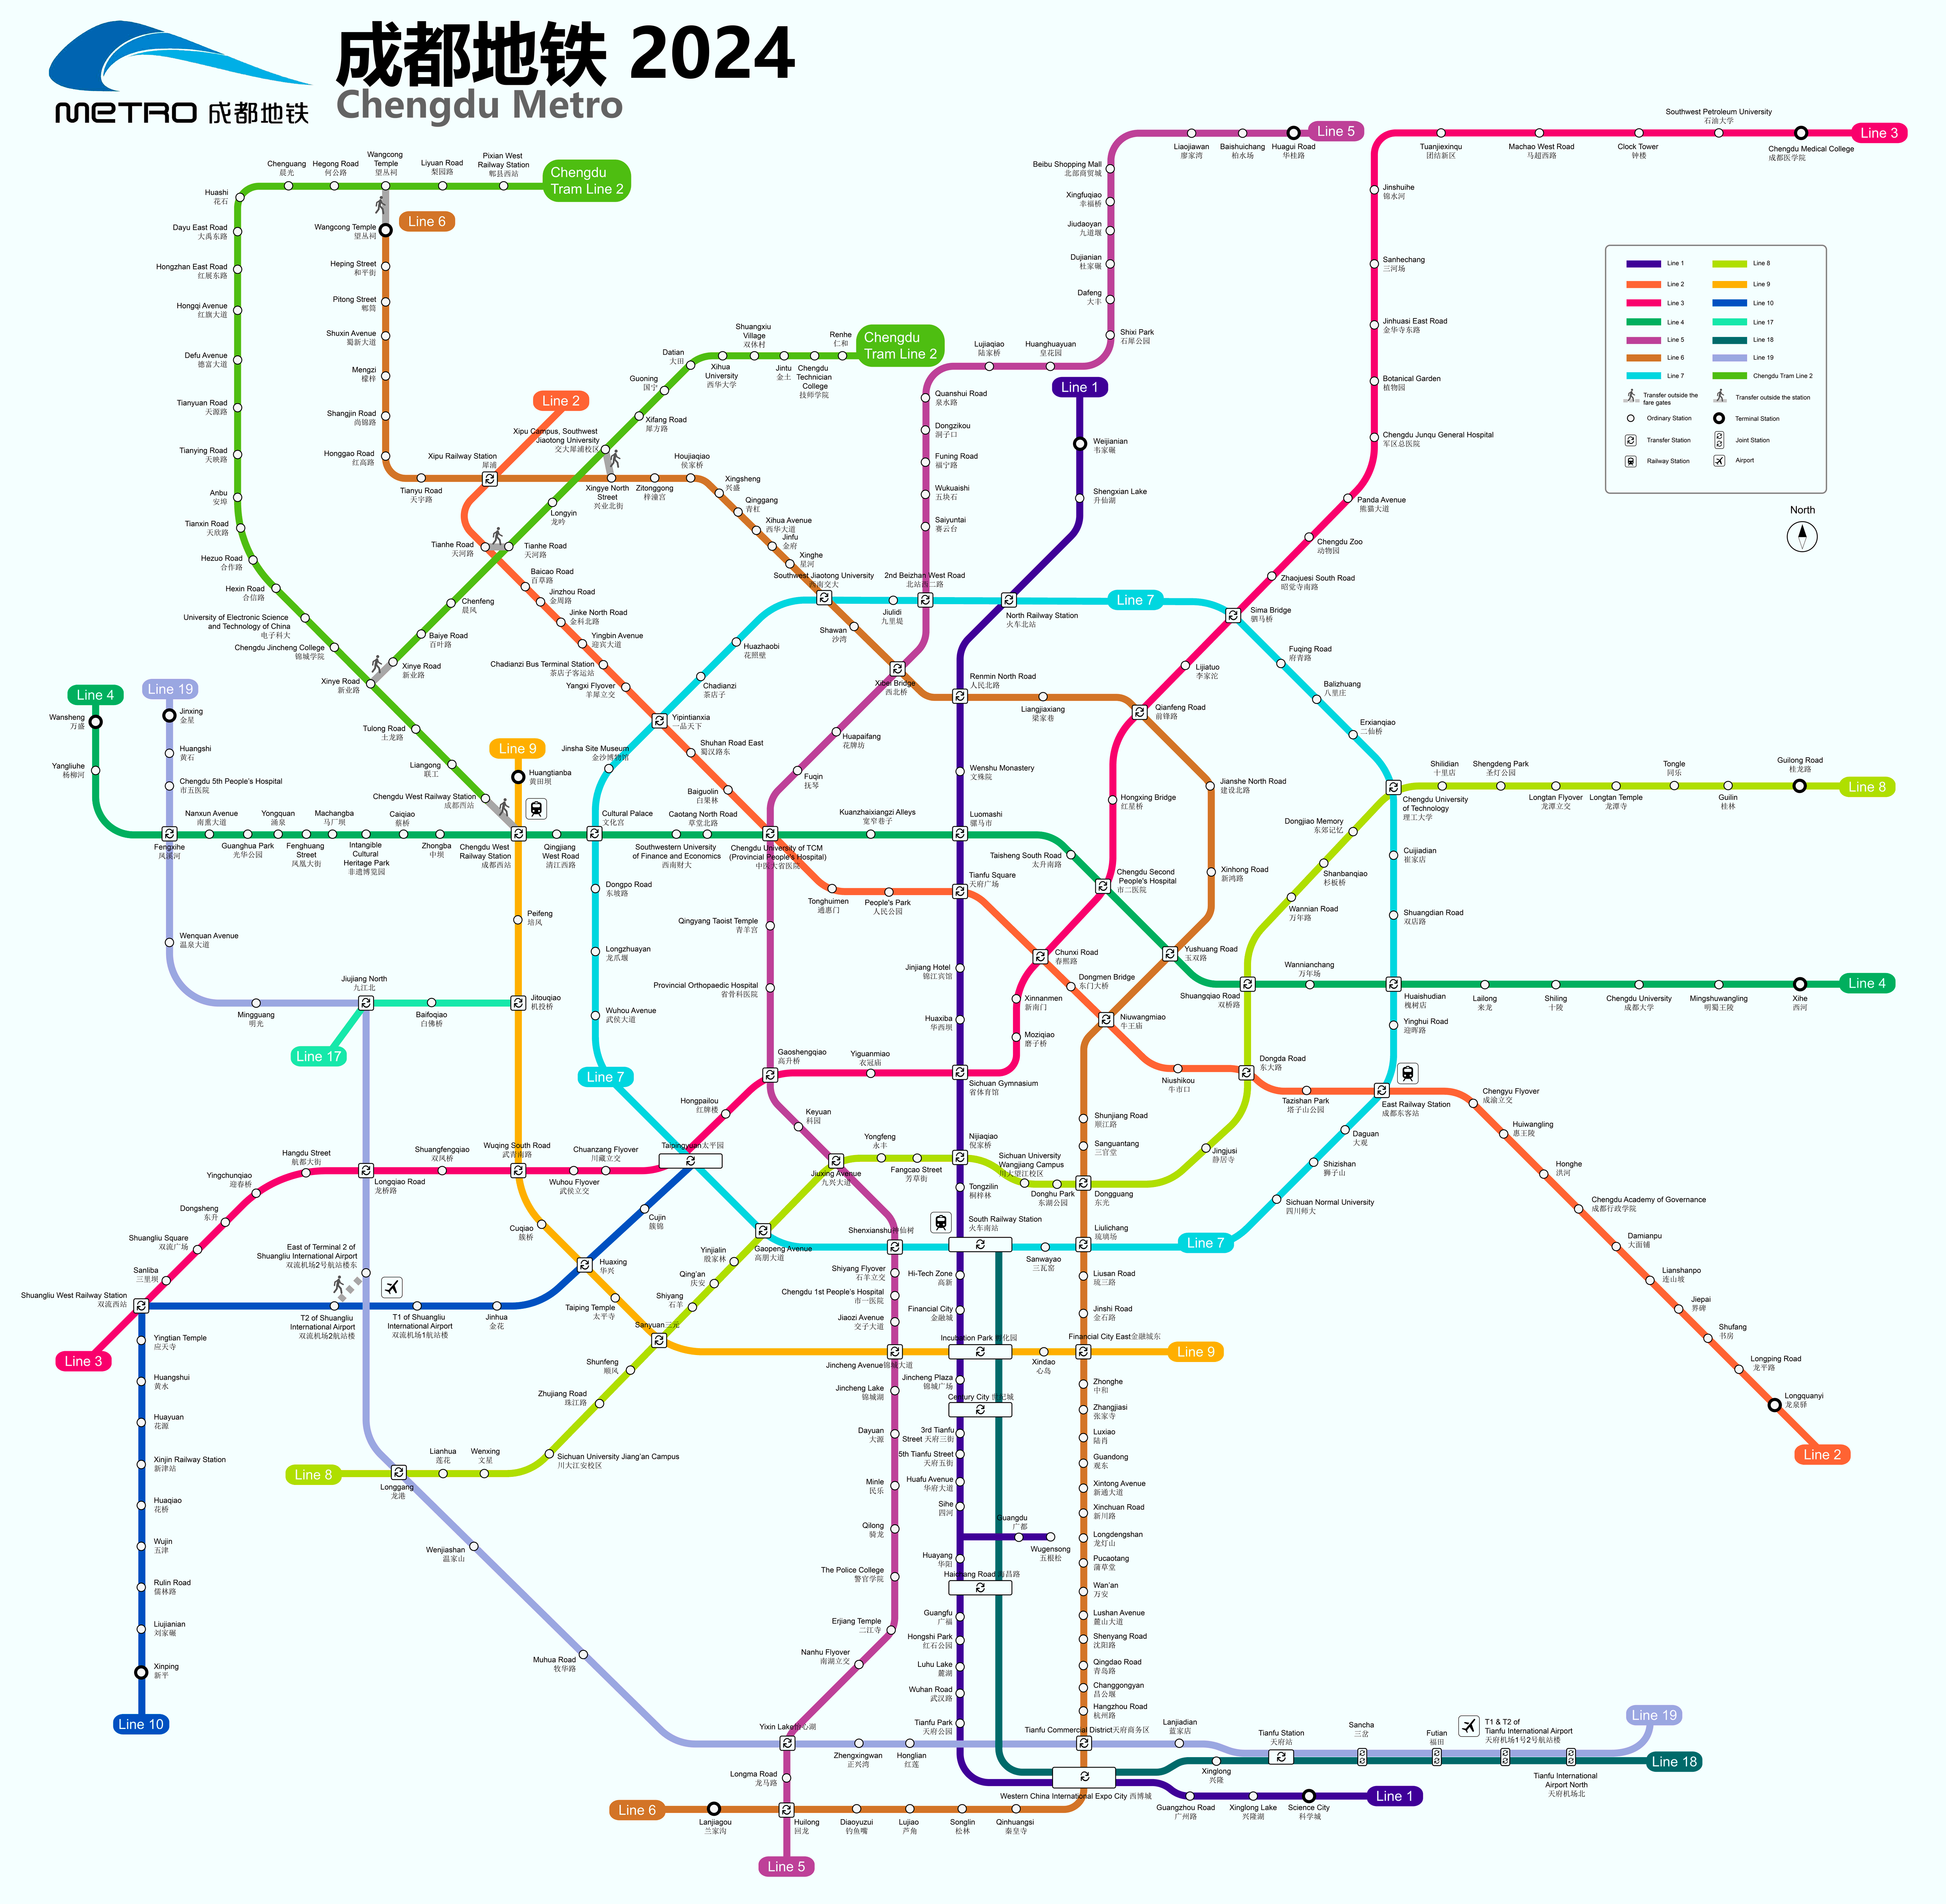
| Chengdu | 14 | 2010 | Metro | 498 | 318 | Tianfu International Airport | Xipu | 5.8 |
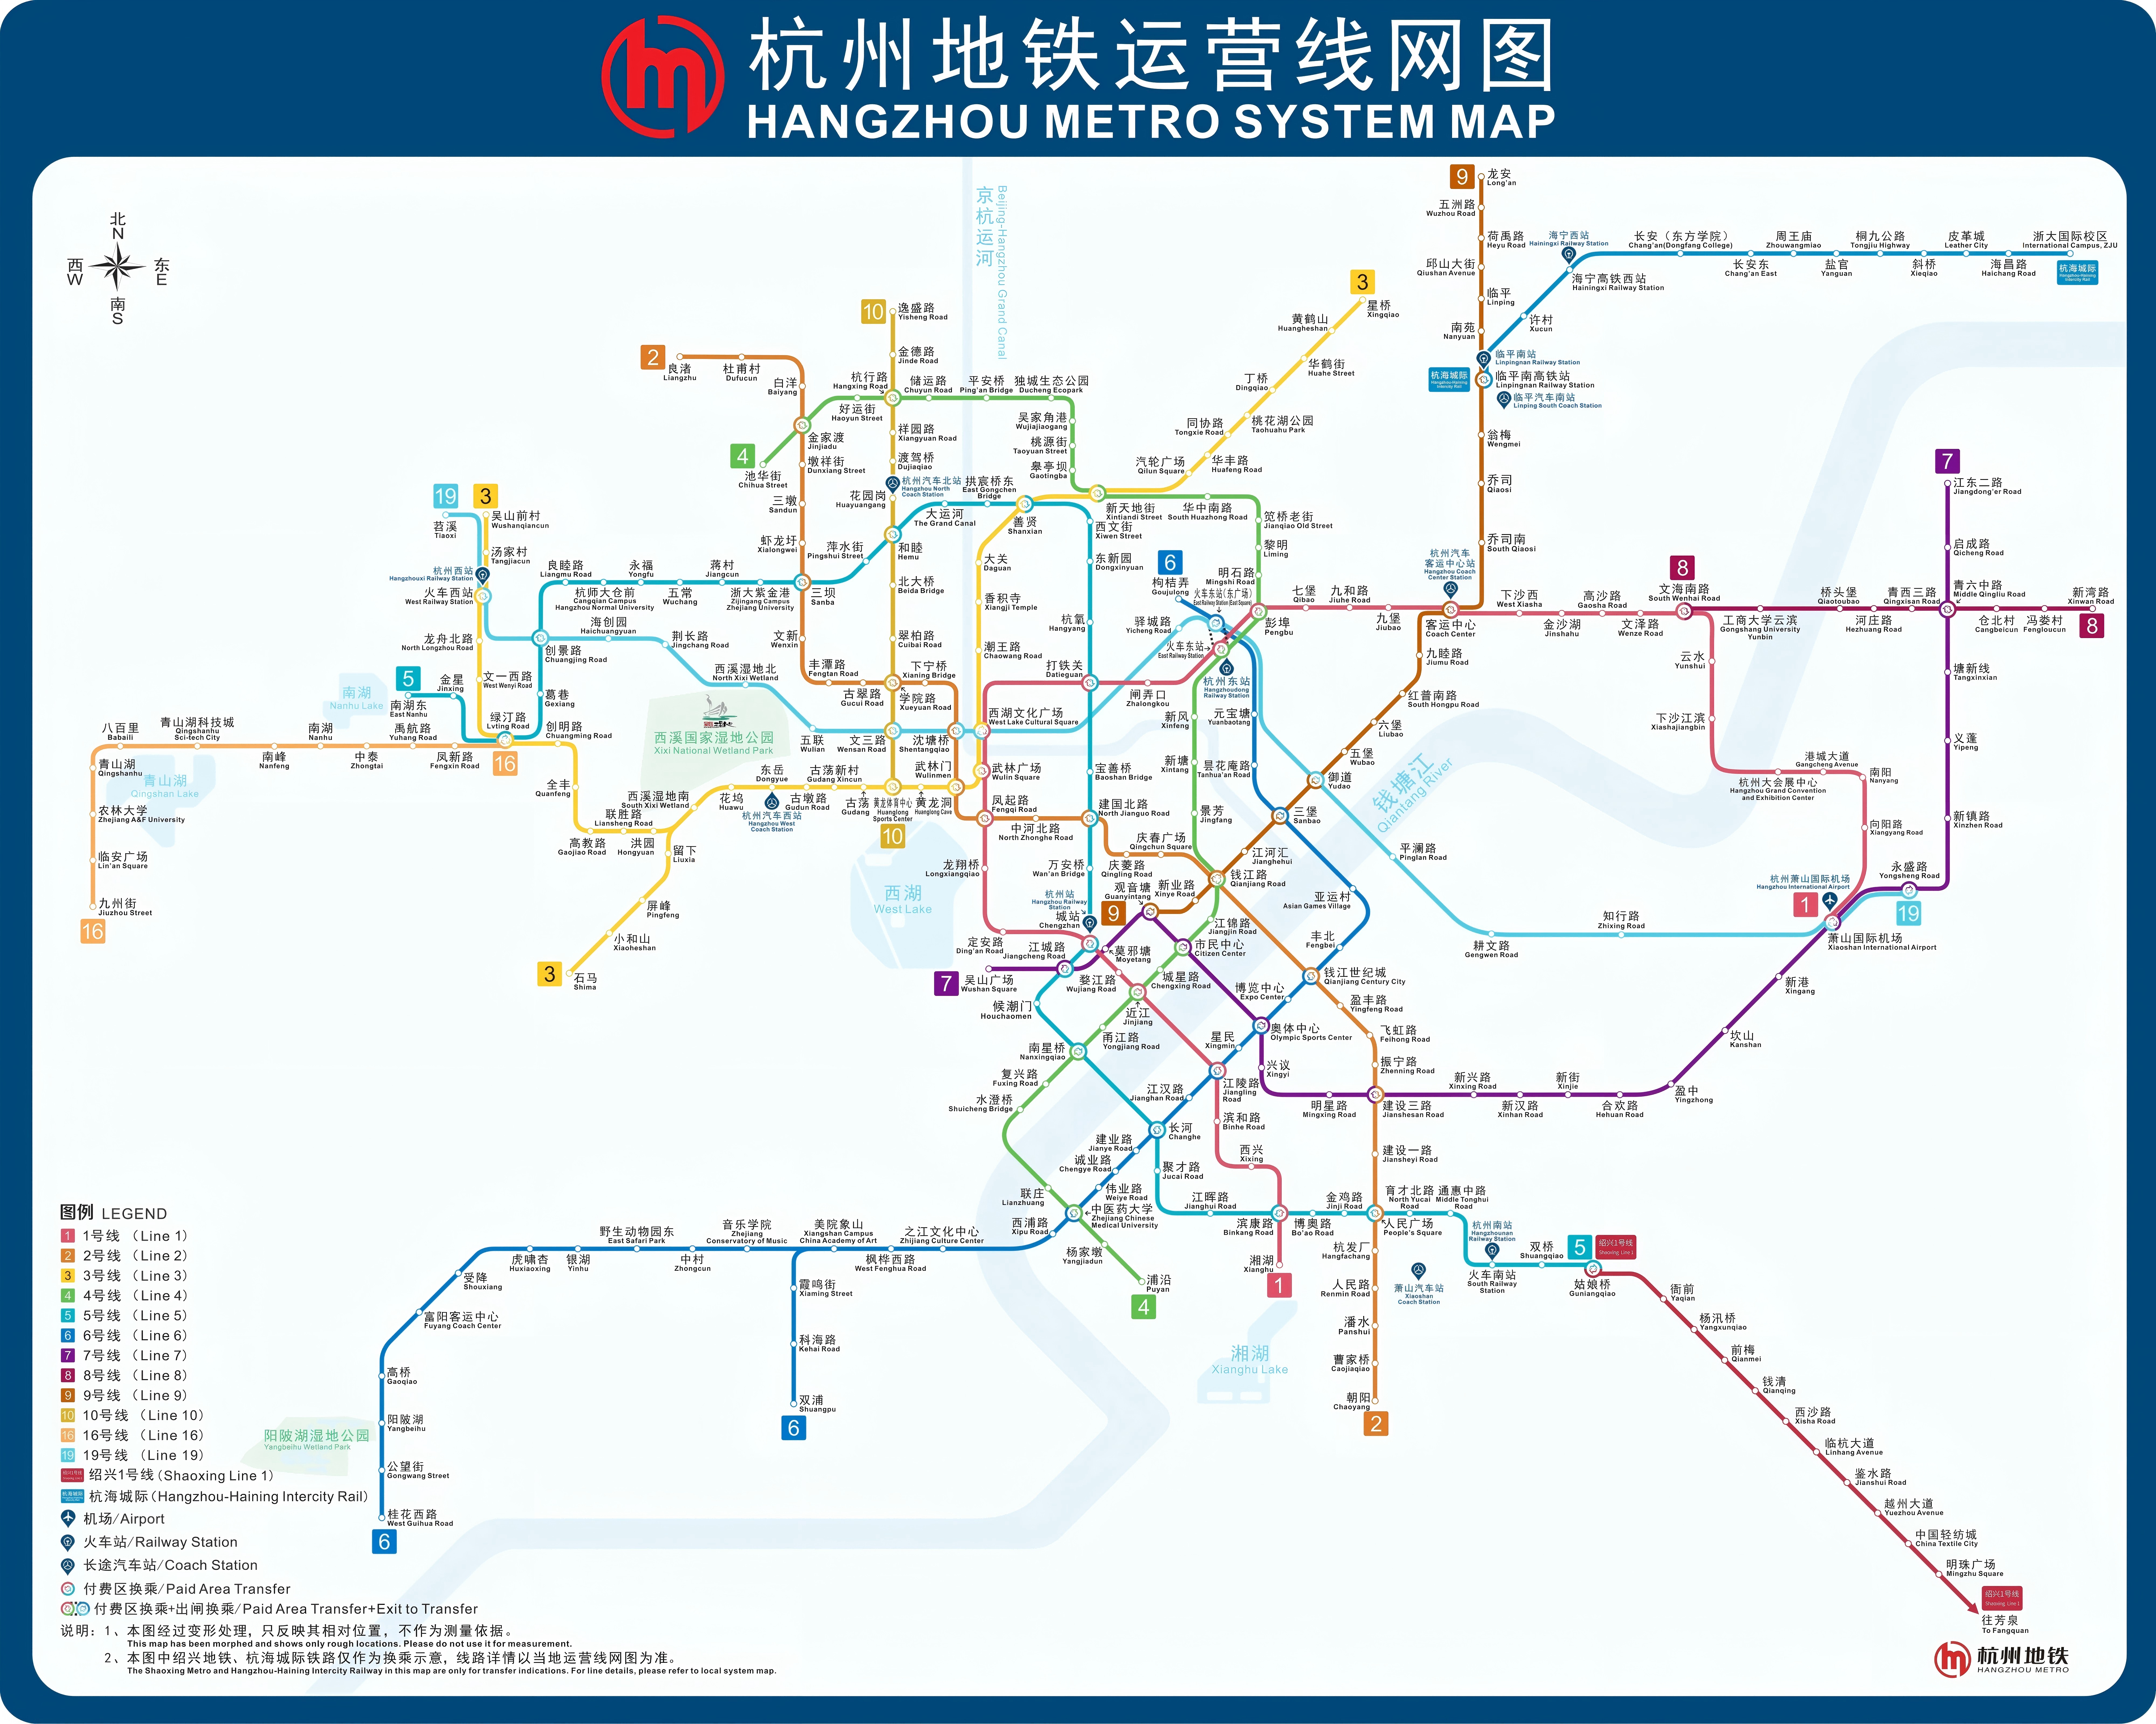
| Hangzhou | 12 | 2012 | Metro | 516 | 279 | Xiangshan | Linping | 5.0 |
| Xi’an | 12 | 2011 | Metro | 423 | 258 | Xianyang International Airport | Fangzhicheng | 4.5 |
| Suzhou | 10 | 2012 | Metro | 370 | 218 | Xiangcheng | Mudu | 3.2 |
| Tianjin | 12 | 2004 | Metro | 372 | 228 | Binhai International Airport | Donghai Road | 3.0 |
| Zhengzhou | 9 | 2013 | Metro | 308 | 197 | Xinglongpu | Xiangyuan Road | 2.8 |
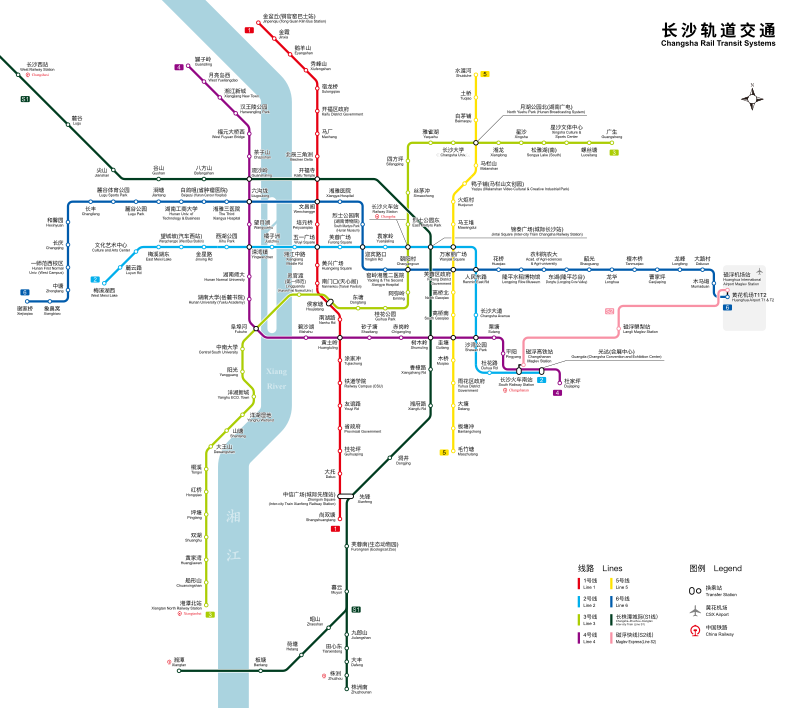
| Changsha | 7 | 2014 | Metro | 240 | 159 | Guangda | Huanghua International Airport | 2.5 |
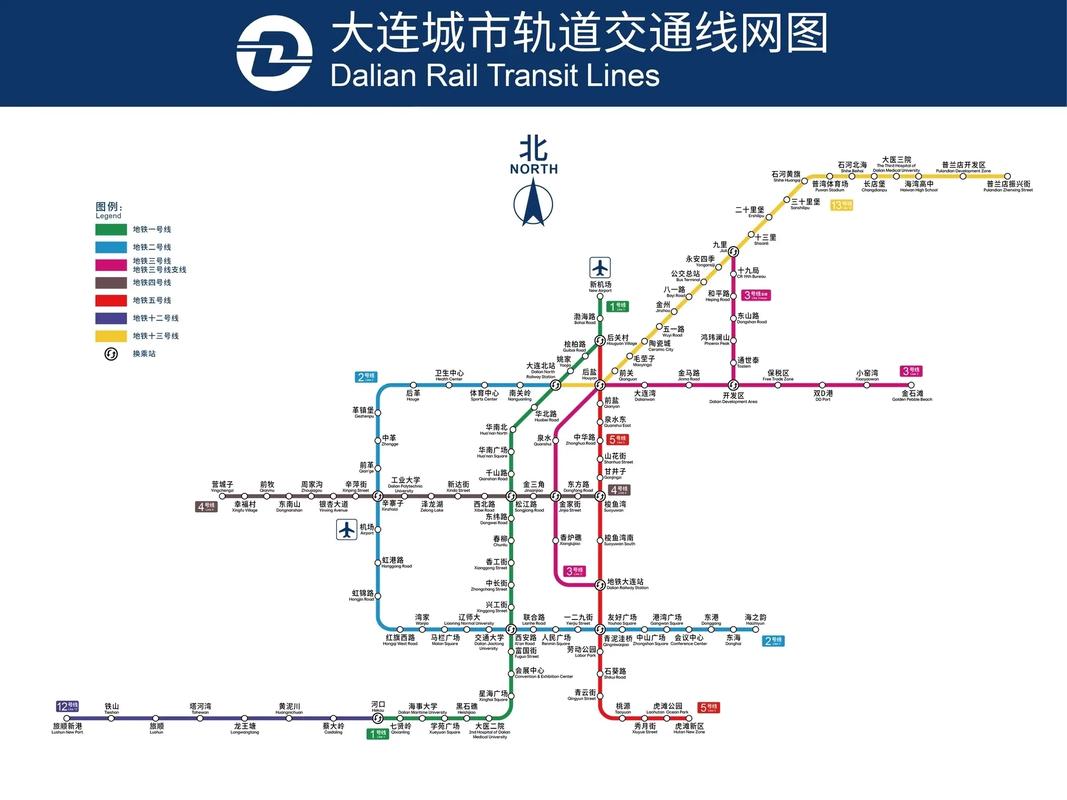
| Dalian | 6 | 2015 | Metro | 217 | 125 | Xinggong Street | Xinghai Square | 1.8 |
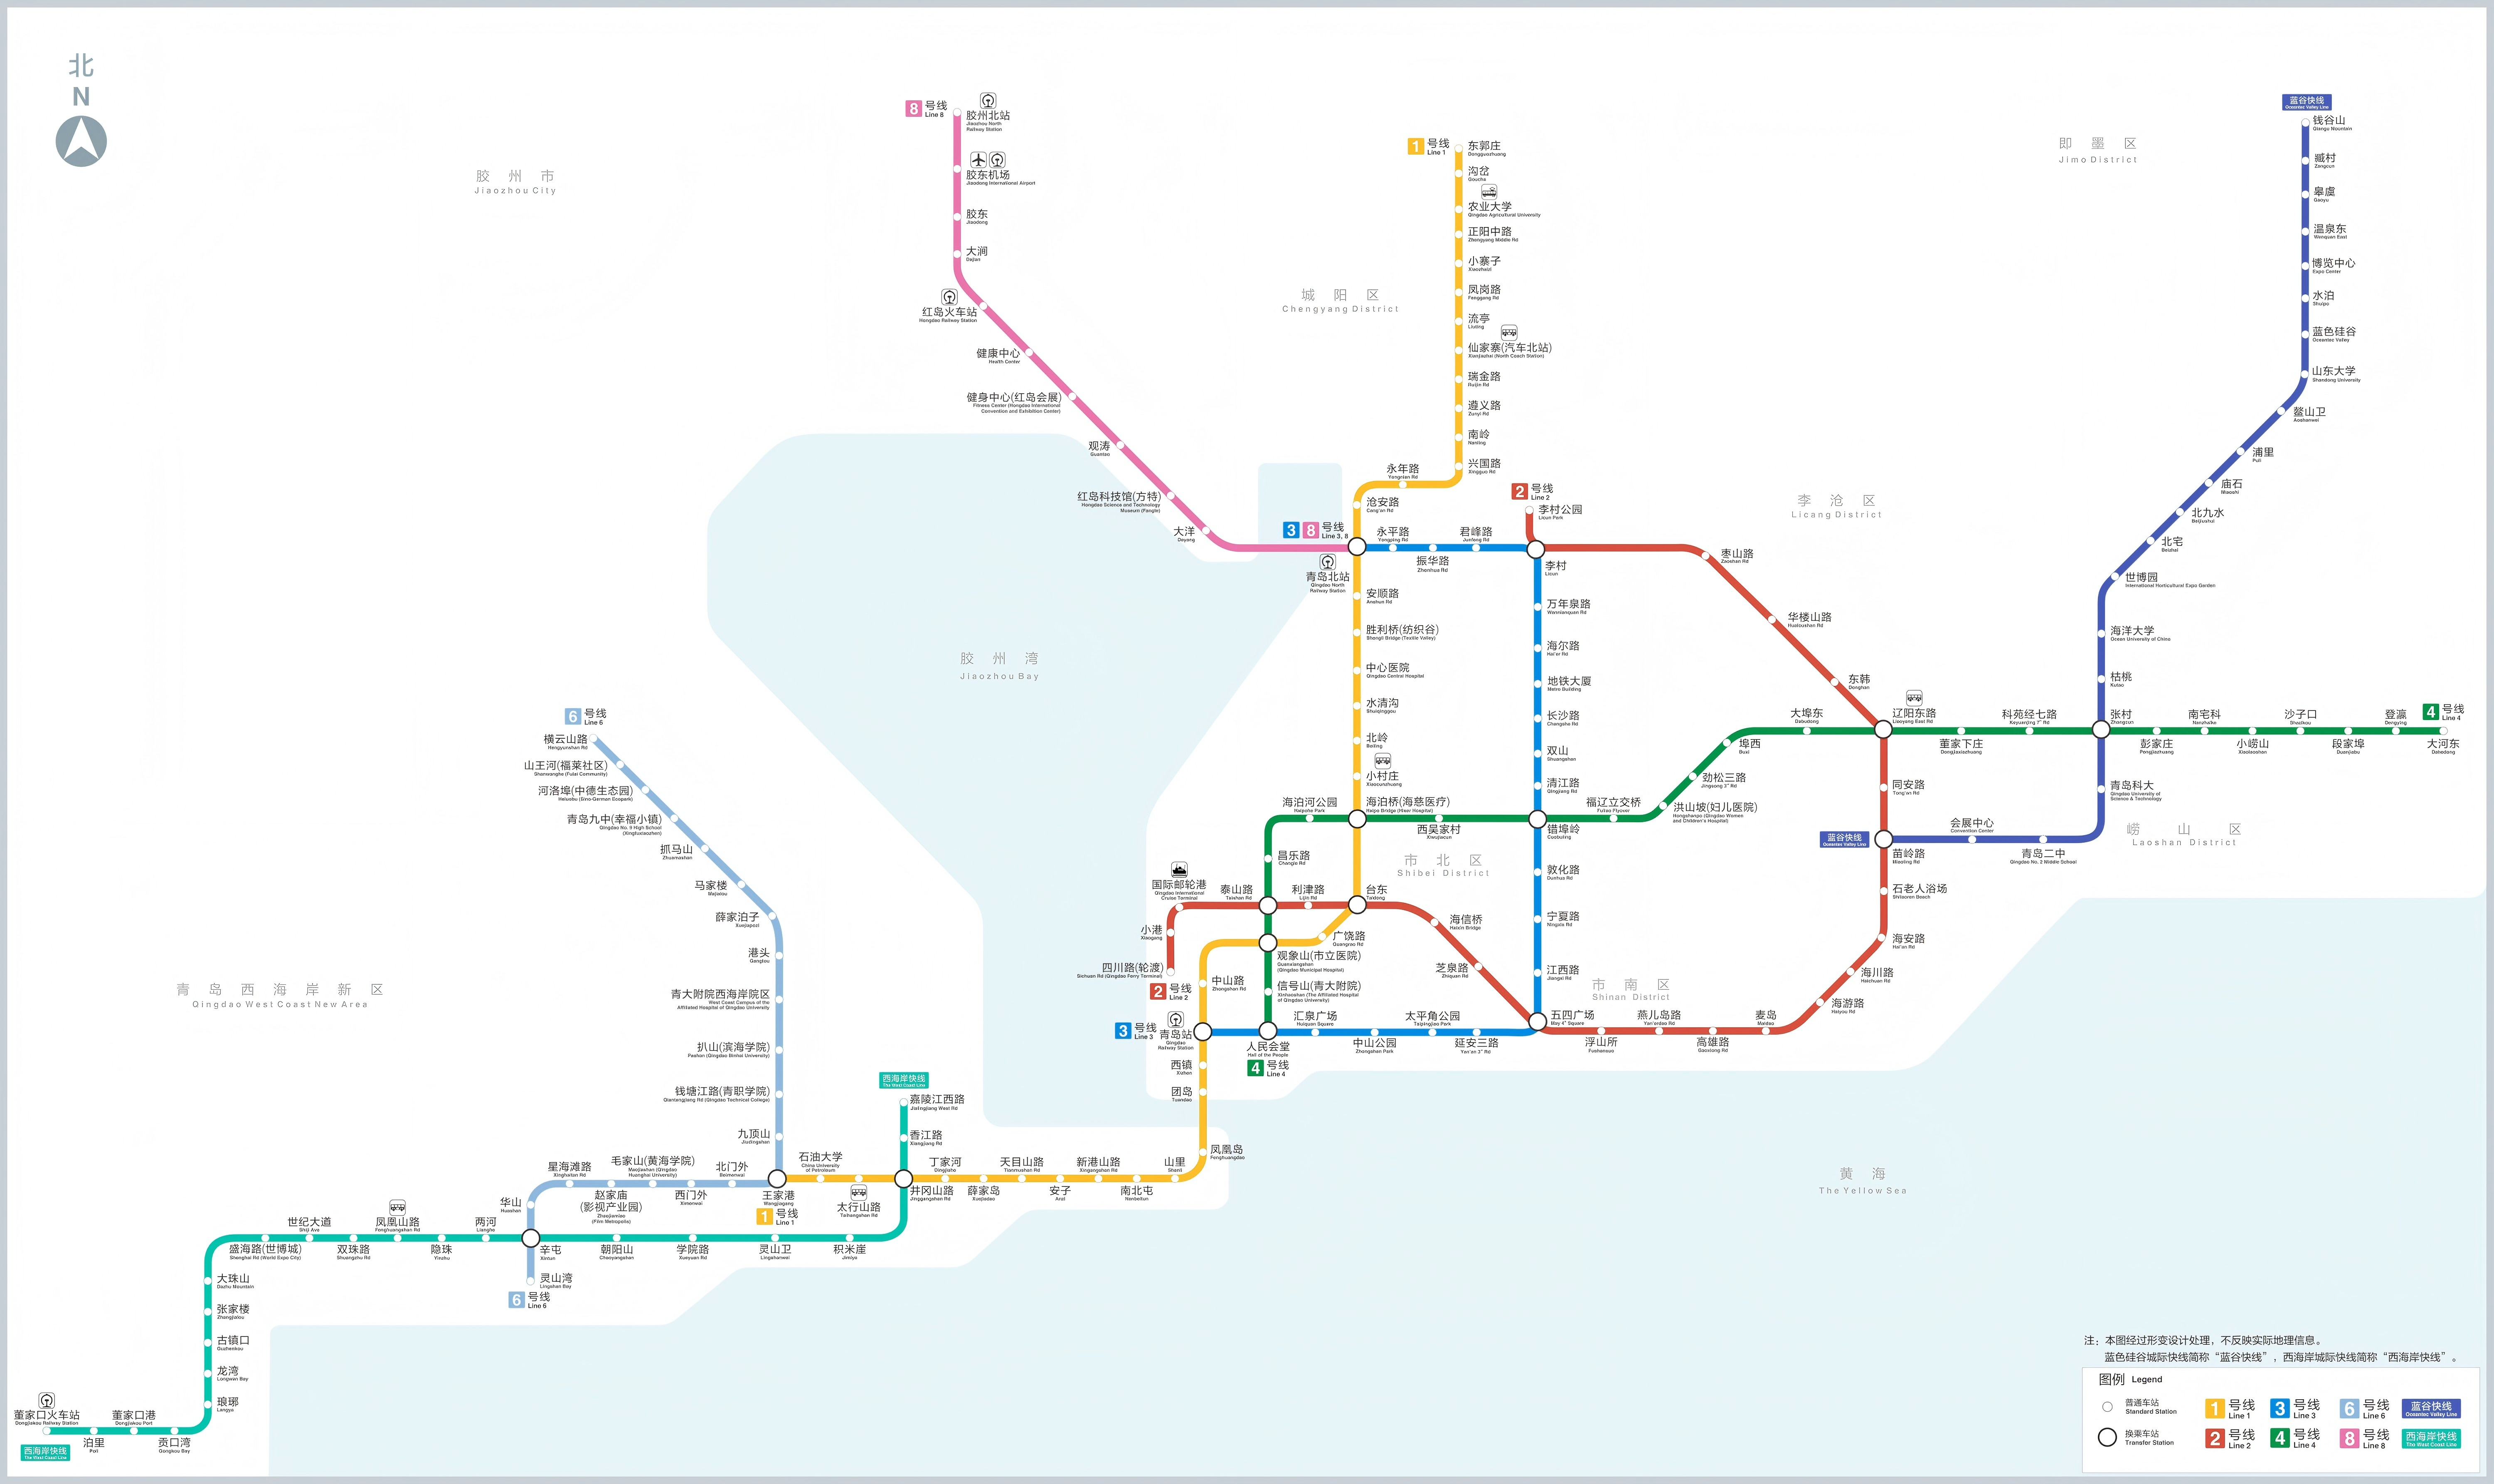
| Qingdao | 8 | 2015 | Metro | 284 | 148 | Qingdao North Railway Station | Jiaozhou Bay | 1.7 |
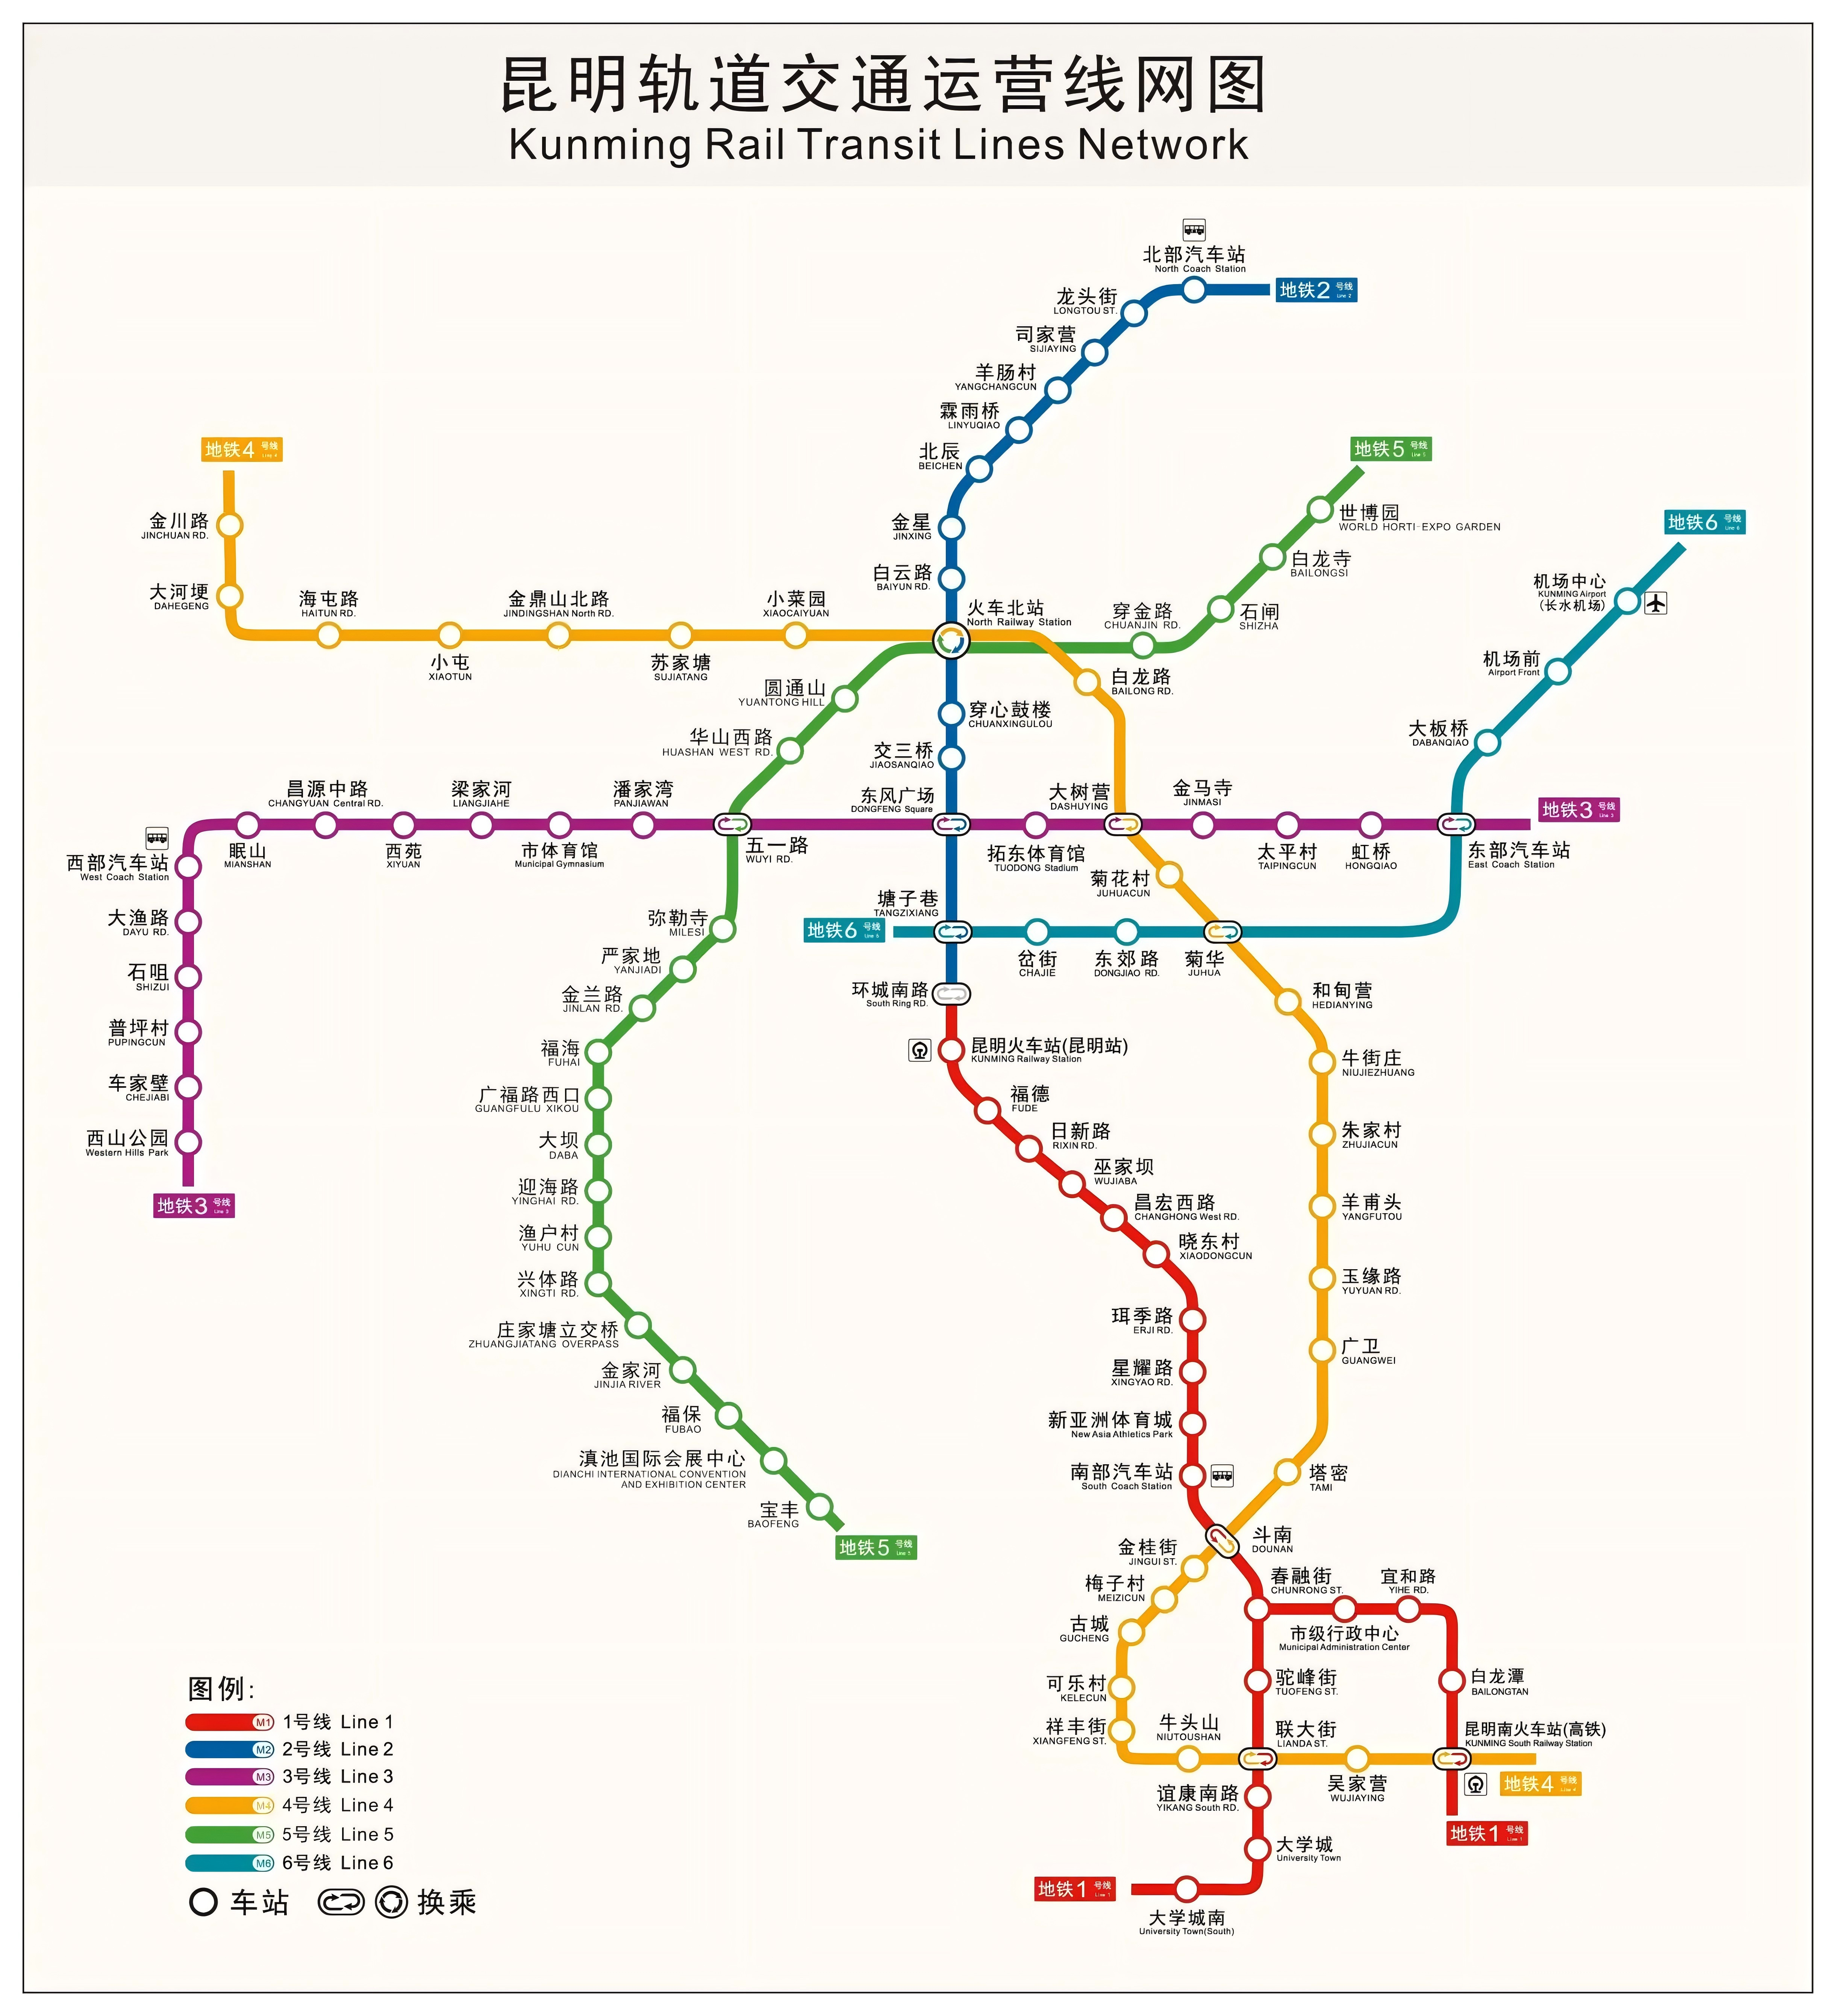
| Kunming | 7 | 2012 | Metro | 215 | 118 | North Railway Station | Kunming South Railway Station | 1.6 |
| Nanning | 5 | 2016 | Metro | 177 | 104 | Nanning East Railway Station | Wuxiang | 1.3 |
| Foshan | 4 | 2016 | Metro | 145 | 82 | Nanzhuang | Guangzhou South Railway Station | 1.1 |
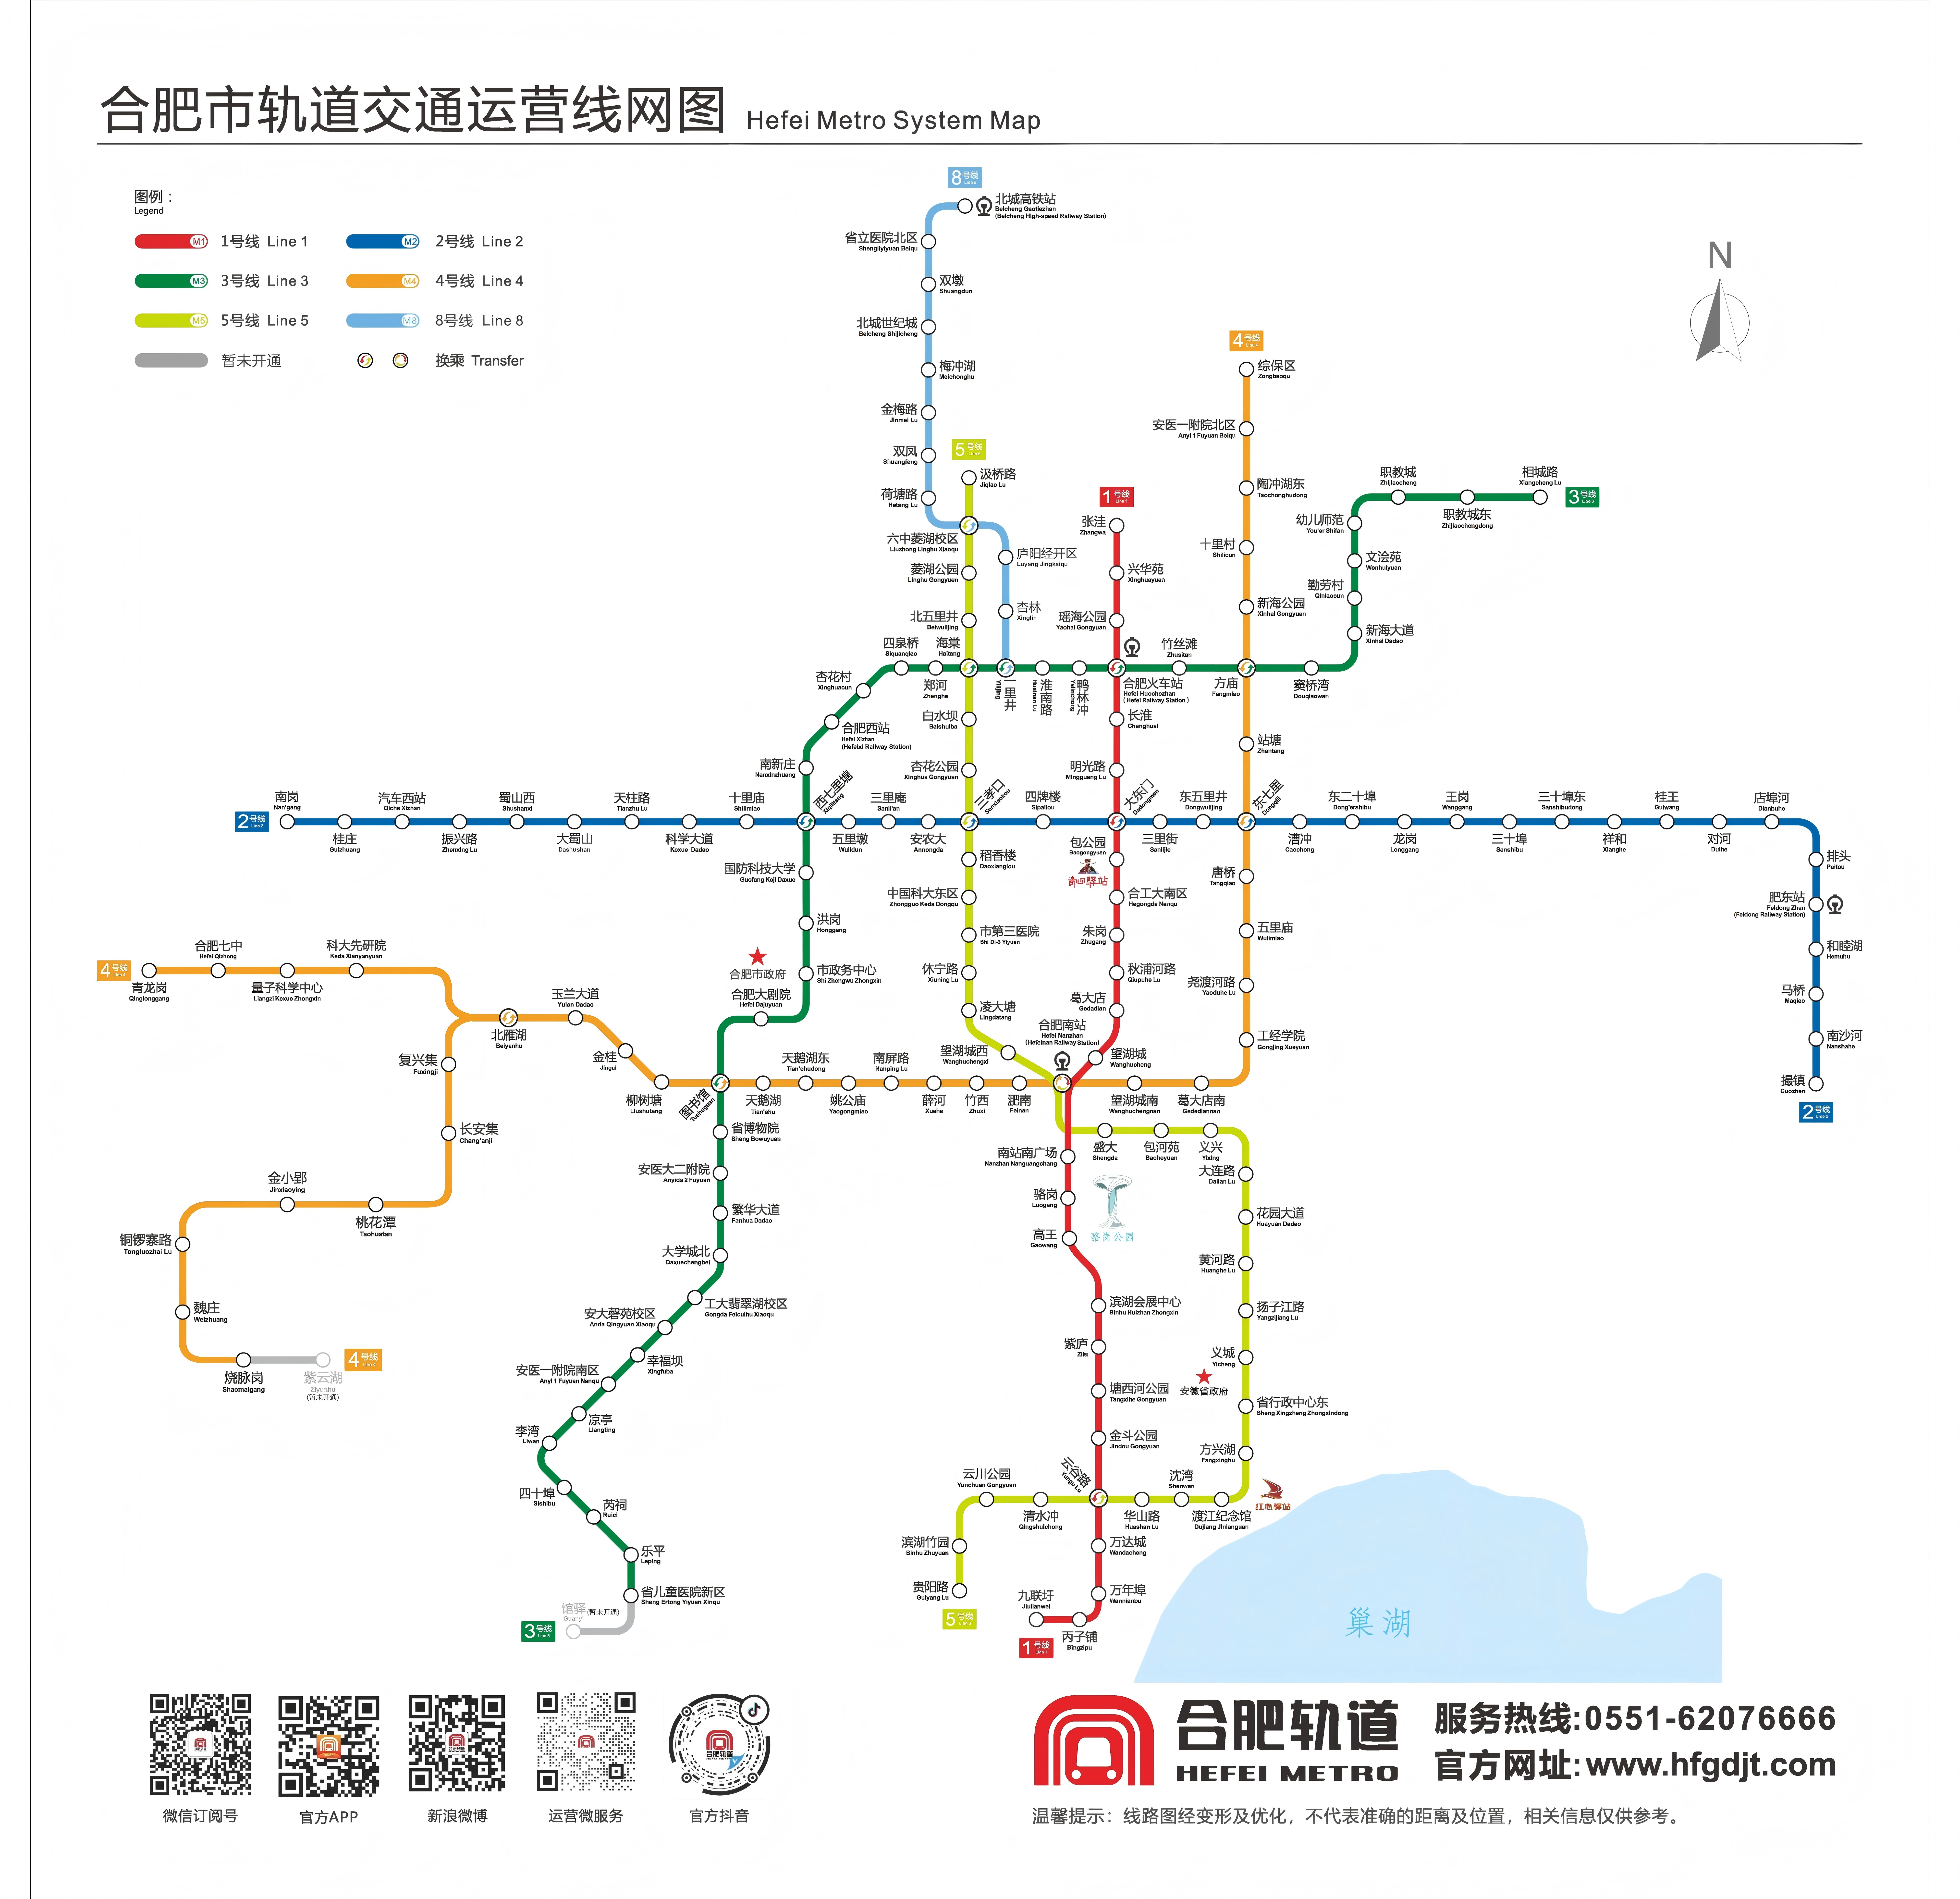
| Hefei | 7 | 2016 | Metro | 210 | 128 | Hefei South Railway Station | Xiangshan Road | 1.2 |
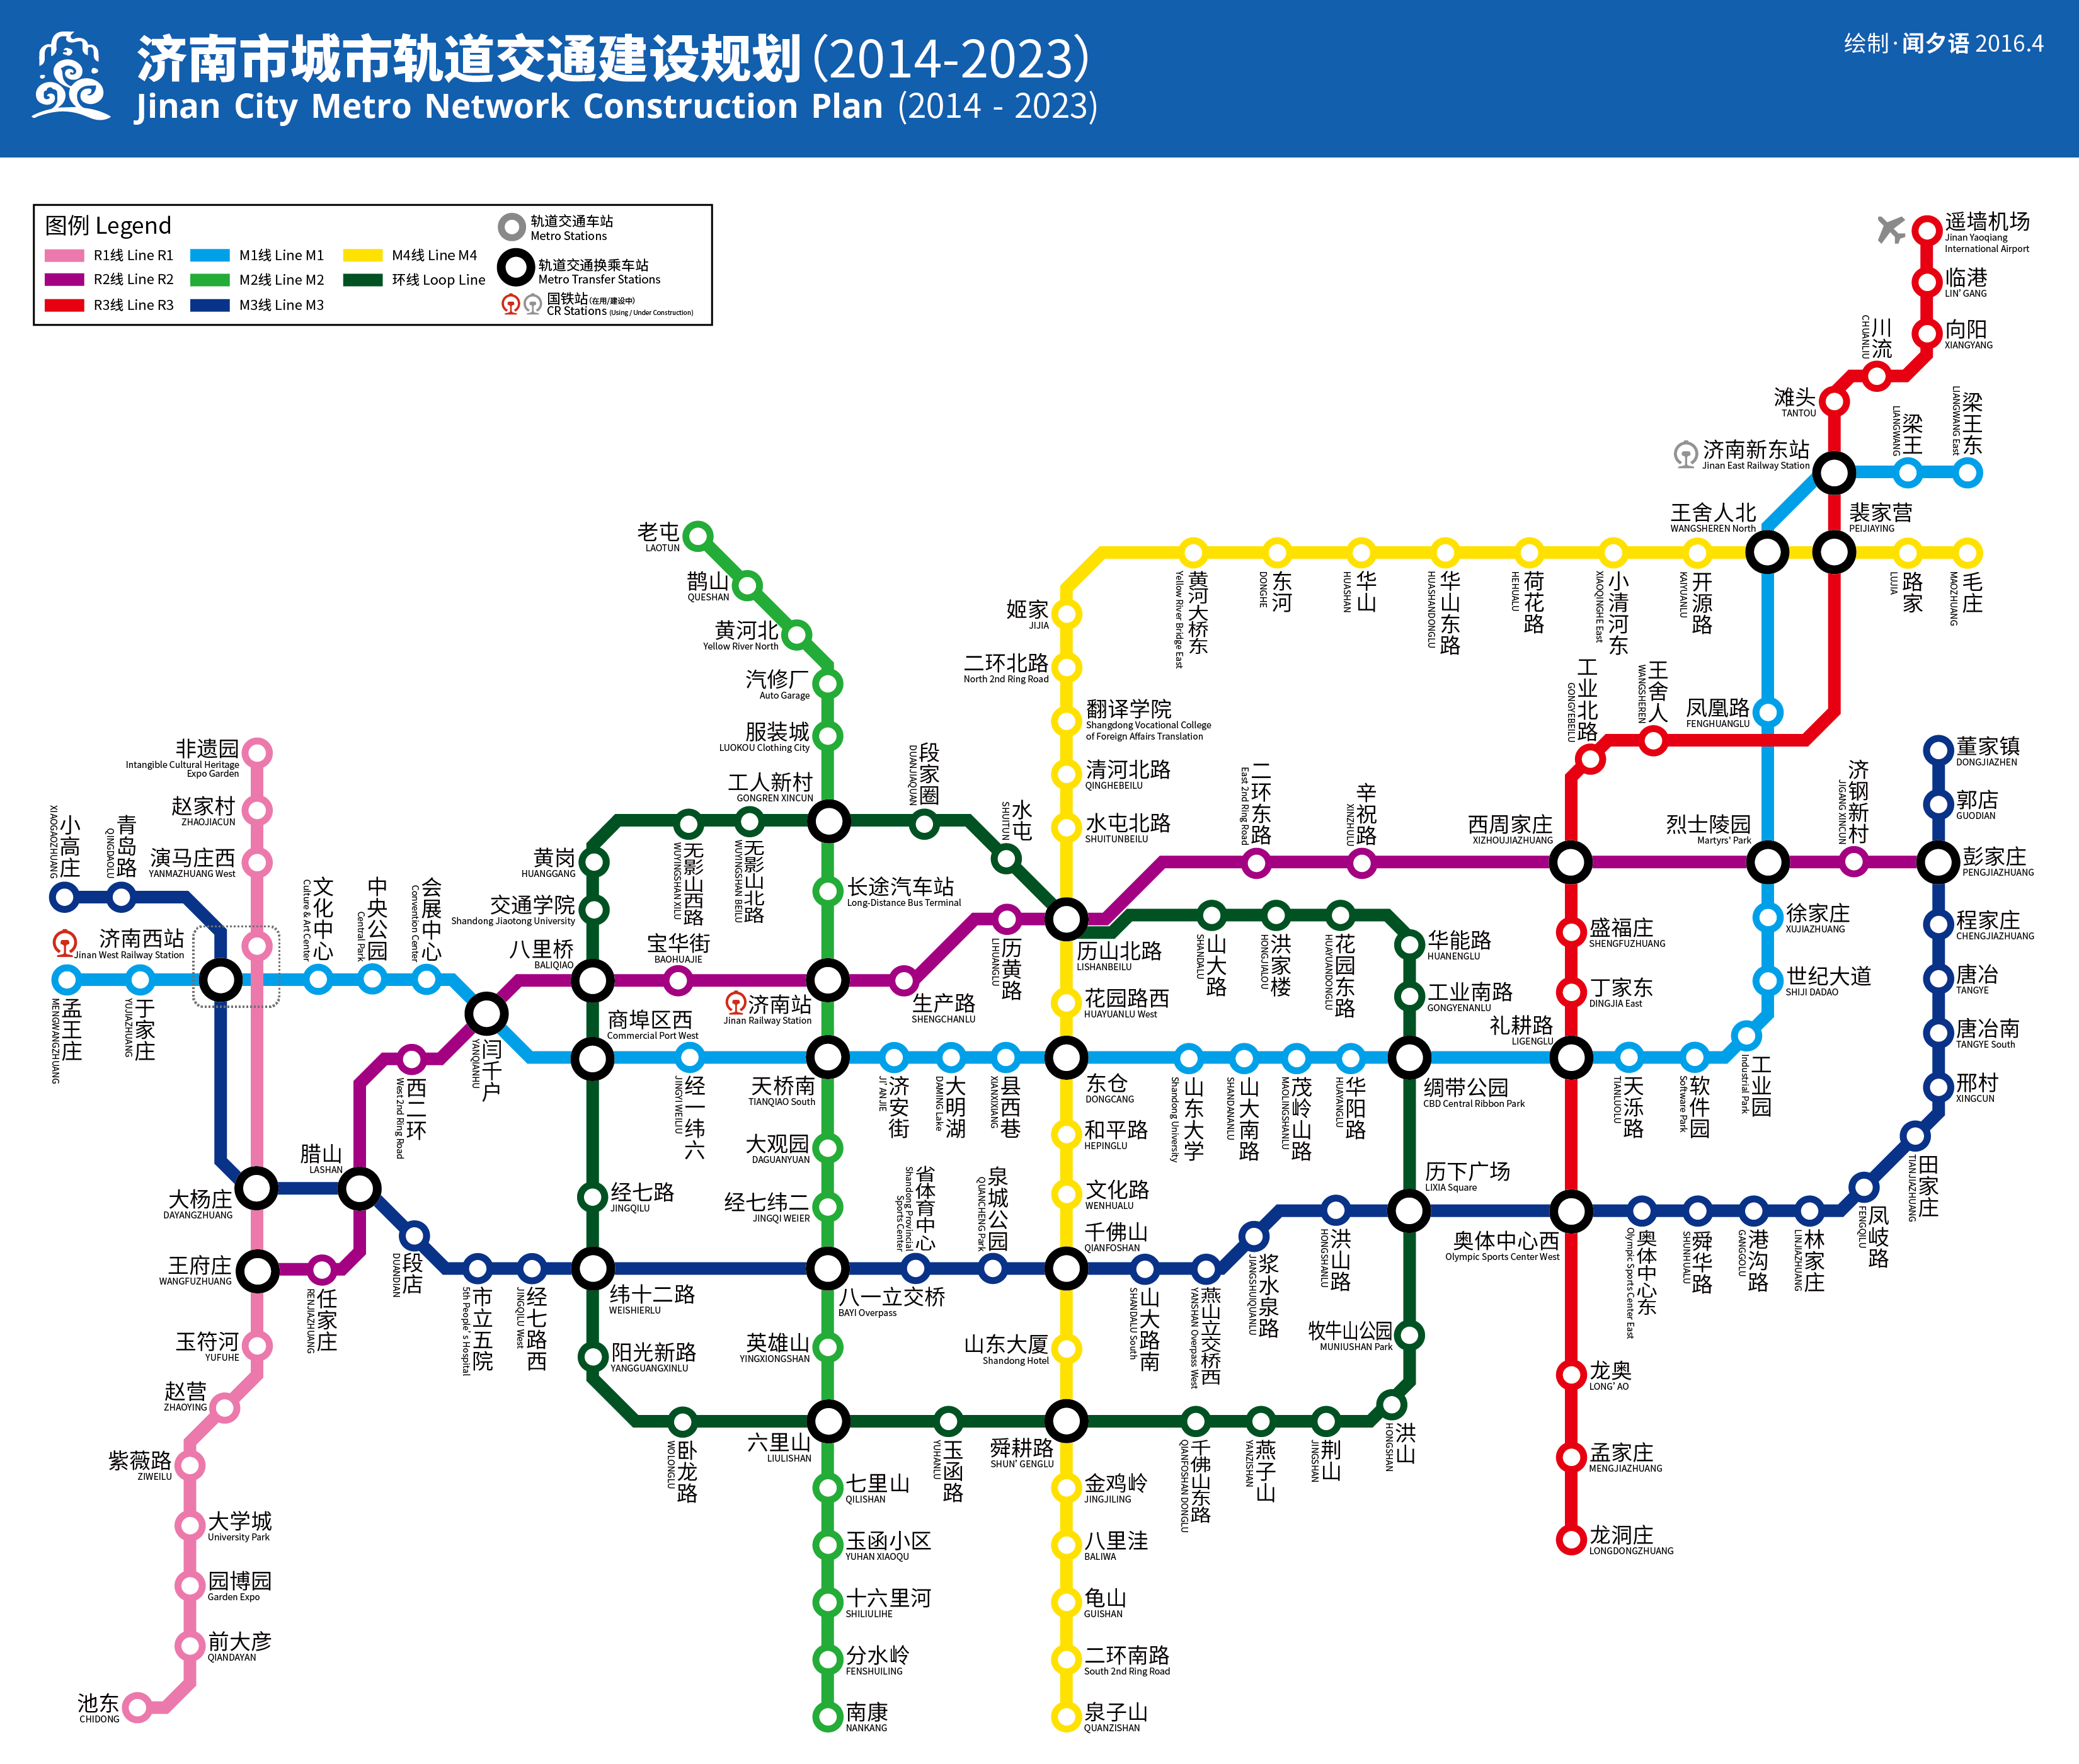
Note: Monorail lines in Chongqing are included in total length and station counts. Ridership figures are average daily figures from 2023–2024 annual reports. Some cities like Jinan, Taiyuan, and Changchun have smaller systems not listed here but are expanding rapidly.
How Much Does It Cost to Ride China’s Subway?
One of the most surprising aspects of China’s metro systems is their affordability. Despite their scale and sophistication, fares remain remarkably low—often less than $0.50 USD per ride.
Fare Structure by City (2024)
- Beijing & Shanghai: Base fare of ¥3 (≈$0.40) for first 6 km, then ¥1 for every additional 5–10 km. Maximum fare: ¥10–12 (≈$1.40–1.70).
- Guangzhou & Shenzhen: ¥2–¥10 based on distance. A 30-km ride costs just ¥8.
- Chongqing: Unique pricing due to monorail and mountain terrain. Starts at ¥2, max ¥8.
- Wuhan & Nanjing: ¥2–¥7 range. No surcharge for transfers.
- Chengdu & Hangzhou: ¥2–¥8. Free transfers within 90 minutes.
- Xi’an & Zhengzhou: ¥2–¥6. Discounted fares for students and seniors.
Payment Methods
China’s subway systems are among the most cashless in the world:
- Mobile Payments: Alipay and WeChat Pay dominate. Simply tap your phone at the gate.
- QR Code Tickets: Generated via city-specific apps (e.g., Shanghai Metro app, Guangzhou Metro app).
- Transport Cards: Local smart cards (e.g., Beijing Yikatong, Shanghai Jiaotong Card) offer 10% discounts.
- NFC & Biometric Entry: Shenzhen and Hangzhou now support facial recognition for entry—no card or phone needed.
“I used to carry three different metro cards in my wallet. Now I just open WeChat and scan. It’s faster than paying with cash,” says Liu Mei, a 32-year-old engineer in Shenzhen.
Discounts & Special Offers
- Student Discounts: 50% off with valid ID (nationwide).
- Senior Discounts: Free rides for citizens over 70 (varies by city).
- Ride Bundles: Monthly passes in Shanghai and Beijing offer unlimited rides for ¥100–150.
- Airport Links: Some cities offer discounted airport express fares (e.g., Shanghai Line 2 to Pudong: ¥10 instead of ¥15).
What Makes China’s Subways Unique? 7 Standout Features
1. Driverless Lines Are the Norm, Not the Exception
Shenzhen’s Line 14 and Line 20 are fully automated, with no drivers or attendants. Chengdu’s Line 18 and Hangzhou’s Line 19 use AI-driven scheduling to adjust train frequency based on real-time passenger flow. These systems reduce delays by 40% compared to manually operated lines.
2. Underground Shopping Malls & Cultural Hubs
Beijing’s Dongdan Station has a 3,000-square-meter underground mall with cafes, bookstores, and even a mini art gallery. Shanghai’s People’s Square Station features rotating exhibitions from the Shanghai Museum. These aren’t gimmicks—they’re revenue generators that help offset operational costs.
3. Climate-Controlled Platforms
In cities like Chongqing and Wuhan, where summer temperatures hit 40°C (104°F), subway platforms are fully air-conditioned. This is rare globally and significantly improves rider comfort and safety.
4. Real-Time Crowding Alerts
All major metro apps now show live occupancy levels per carriage. You can see if Carriage 3 is “crowded” or “empty” before boarding—reducing physical contact and improving hygiene, especially post-pandemic.
5. Multilingual Signage & Voice Announcements
Even in smaller cities like Nanning and Kunming, station signs are in Chinese, English, and often Mandarin, Cantonese, and Korean. Voice announcements on trains include Mandarin, English, and sometimes local dialects.
6. Integration with High-Speed Rail
Most major metro systems connect directly to high-speed rail stations. In Guangzhou, you can transfer from Line 3 to Guangzhou South Railway Station in 8 minutes. In Shanghai, Line 17 links directly to Hongqiao Airport and its high-speed rail hub.
7. 24-Hour Service on Key Lines
Beijing’s Line 1 and Line 2 now run 24/7 on weekends. Shanghai’s Line 1 and Line 10 offer overnight service during holidays. This is unprecedented outside of global hubs like Tokyo and London.
Frequently Asked Questions (FAQs) About China’s Subway System
Q: Can tourists use the subway easily in China?
A: Absolutely. All major stations have English signage, and apps like Baidu Maps and Google Maps (with offline download) provide accurate metro routing. Alipay’s “Tour Pass” lets foreigners load ¥50–200 for 3–7 days of unlimited rides. No Chinese ID needed.
Q: Are subways safe in China?
A: Yes. China’s metro systems have some of the lowest crime rates in the world. CCTV coverage is 100%, and station staff patrol every 5–10 minutes. Emergency buttons are clearly marked and respond within 30 seconds.
Q: Can I bring luggage on the subway?
A: Yes, but oversized items (over 1.2m in length) are restricted during peak hours (7–9 AM, 5–7 PM). Most stations have luggage elevators and dedicated boarding areas.
Q: Do subways run late at night?
A: Most lines stop between 11 PM and midnight. However, key lines in Beijing, Shanghai, Guangzhou, and Shenzhen offer extended service on weekends and holidays—check local apps for updates.
Q: Is there Wi-Fi on China’s subways?
A: Yes. Free public Wi-Fi is available in all major stations and most trains. Network name: “ChinaMetro-Free.” No password required.
Q: How do I transfer between lines?
A: Transfers are seamless. Follow color-coded signs and digital displays. Most transfers take 3–8 minutes. In Shanghai’s People’s Square Station, you can transfer between 5 lines without going upstairs.
Q: Are there gender-segregated cars?
A: Some cities (e.g., Guangzhou, Chengdu) have designated “women-only” cars during peak hours (7:30–9:30 AM). These are clearly marked with pink signage. Not mandatory, but widely respected.
Q: What happens if I miss my stop?
A: Don’t panic. All trains announce stops in Mandarin and English. If you miss your stop, simply ride to the next station and take the return train. Most systems allow free reverse travel within 30 minutes.
The Future: What’s Next for China’s Subway Networks?
China isn’t slowing down. By 2030, the government aims to expand the national metro network to over 15,000 kilometers, with 40+ cities operating systems. Key upcoming projects include:
- Chongqing’s Line 27: A 66-km automated line connecting the city’s northern and southern districts.
- Shanghai’s Line 21: A 60-km east-west corridor to relieve pressure on Line 2.
- Xi’an’s Line 15: A circular line linking all major universities and tech parks.
- Zhengzhou’s Line 10: A 30-km extension to serve the new airport logistics zone.
Innovation is also accelerating. Trials are underway for:
- Magnetic Levitation (Maglev) Subways: In Shanghai, a 30-km maglev line is being tested for urban use.
- AI-Powered Crowd Prediction: Using machine learning to predict bottlenecks before they happen.
- Solar-Powered Stations: Hangzhou’s new stations feature rooftop solar panels that power lighting and ventilation.
“The next decade will see China’s subways evolve from transport systems into intelligent urban ecosystems,” says Professor Zhang Hua, a transportation engineer at Tongji University. “They’ll manage energy, data, and even public health—like detecting air quality in real time.”
Final Thoughts: Why China’s Subway System Matters Beyond Transportation
China’s subway networks are more than steel rails and concrete tunnels. They’re symbols of national ambition, technological mastery, and social cohesion. In a country where 800 million people live in cities, the subway is the great equalizer—it connects the migrant worker in Shenzhen to the executive in Shanghai, the student in Wuhan to the retiree in Chengdu.
For travelers, it’s the most efficient, affordable, and safe way to explore. For urban planners, it’s a blueprint for sustainable growth. For the world, it’s proof that massive infrastructure can be built quickly, cleanly, and equitably.
As someone who’s ridden subways in 18 countries, I can say without hesitation: China’s metro systems are not just the best in the world—they’re redefining what’s possible.
评论
目前还没有评论。