2025年07月17日 09:24
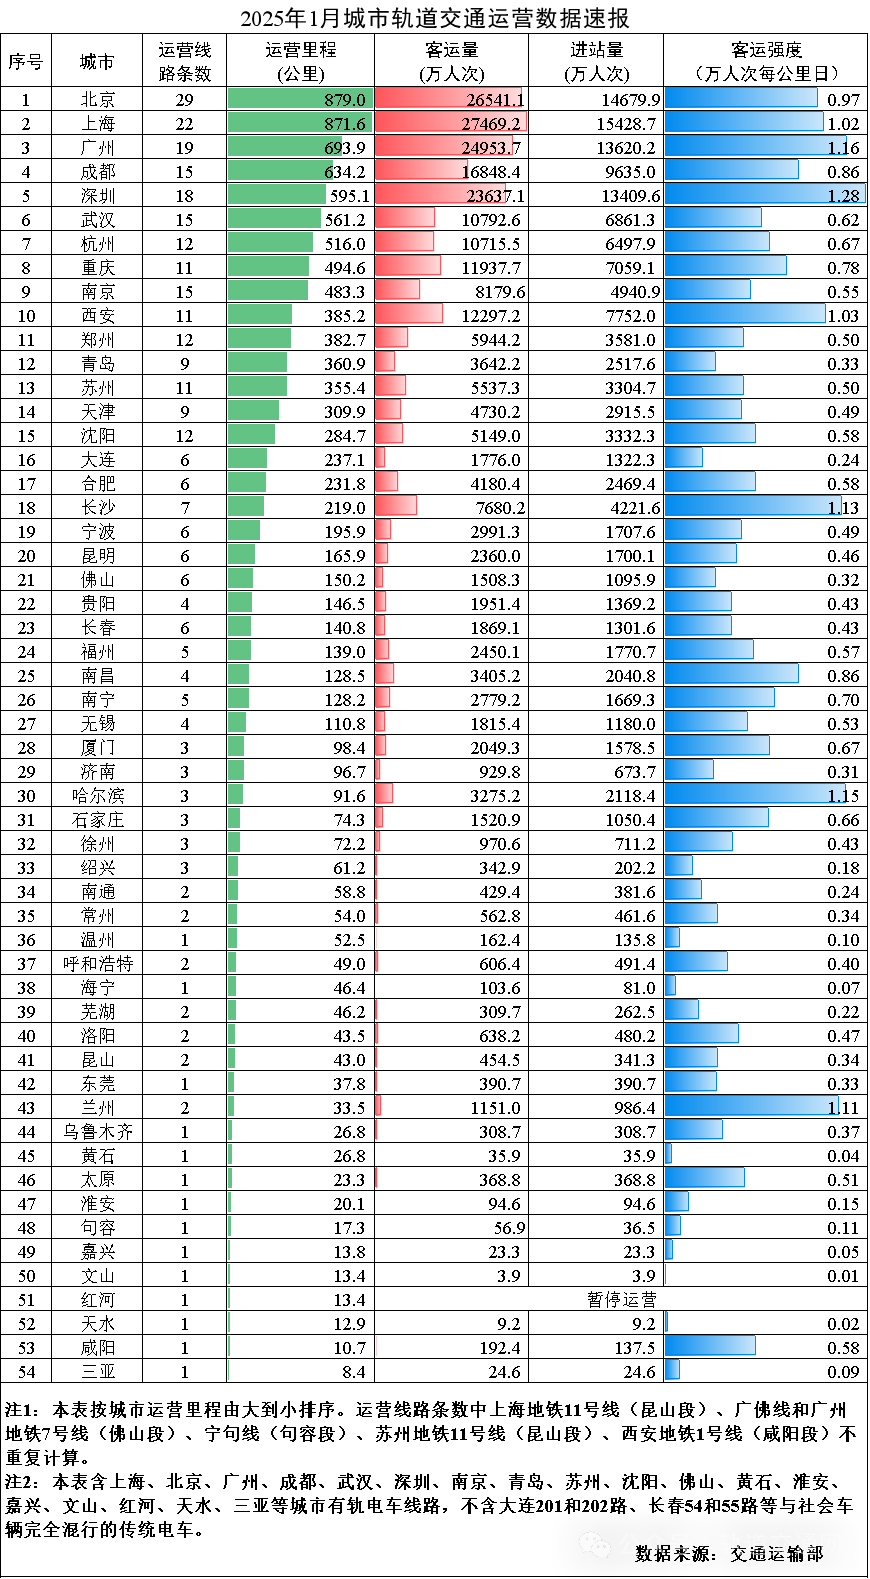
Quick Report on the Operational Data of Urban Rail Transit in January 2025
In January 2025, a total of 325 urban rail transit lines were in operation in 54 cities across 31 provinces (autonomous regions, municipalities directly under the Central Government) and the Xinjiang Production and Construction Corps. The operational mileage was 10,947.3 kilometers, with a total of 3.57 million train trips made, and the passenger volume reached 2.48 billion person-times, and the number of inbound passengers was 1.49 billion person-times. In January, the passenger volume decreased by 33 million person-times compared with the previous month, a decrease of 11.7%, and decreased by 18 million person-times year-on-year, a decrease of 6.8%. The average passenger intensity of the total operational mileage nationwide in January was 7,310 person-times per kilometer per day, a decrease of 14.3% compared with the previous month and a decrease of 13.1% year-on-year.
Among them, 267 subway and light rail lines were in operation in 43 cities, with an operational mileage of 9,479.3 kilometers, a passenger volume of 2.4 billion person-times, and the number of inbound passengers of 1.43 billion person-times. In 16 cities, 25 monorail, maglev, and suburban rapid rail transit lines were in operation, with an operational mileage of 970.7 kilometers, a passenger volume of 74.97 million person-times, and the number of inbound passengers of 50.62 million person-times. In 18 cities, 33 tram and automated guideway transit lines were in operation, with an operational mileage of 497.3 kilometers, a passenger volume of 9.6 million person-times, and the number of inbound passengers of 9.13 million person-times.
This month, the operational mileage increased by 1.7 kilometers, and one new operational section was added, which was the west extension section of Line 4 of Ningbo Metro.
China Metro Data Table
Please wait while the data is being loaded.
Related
评论
目前还没有评论。