2025年07月17日 09:24
Operational Data Report of Urban Rail Transit in March 2025
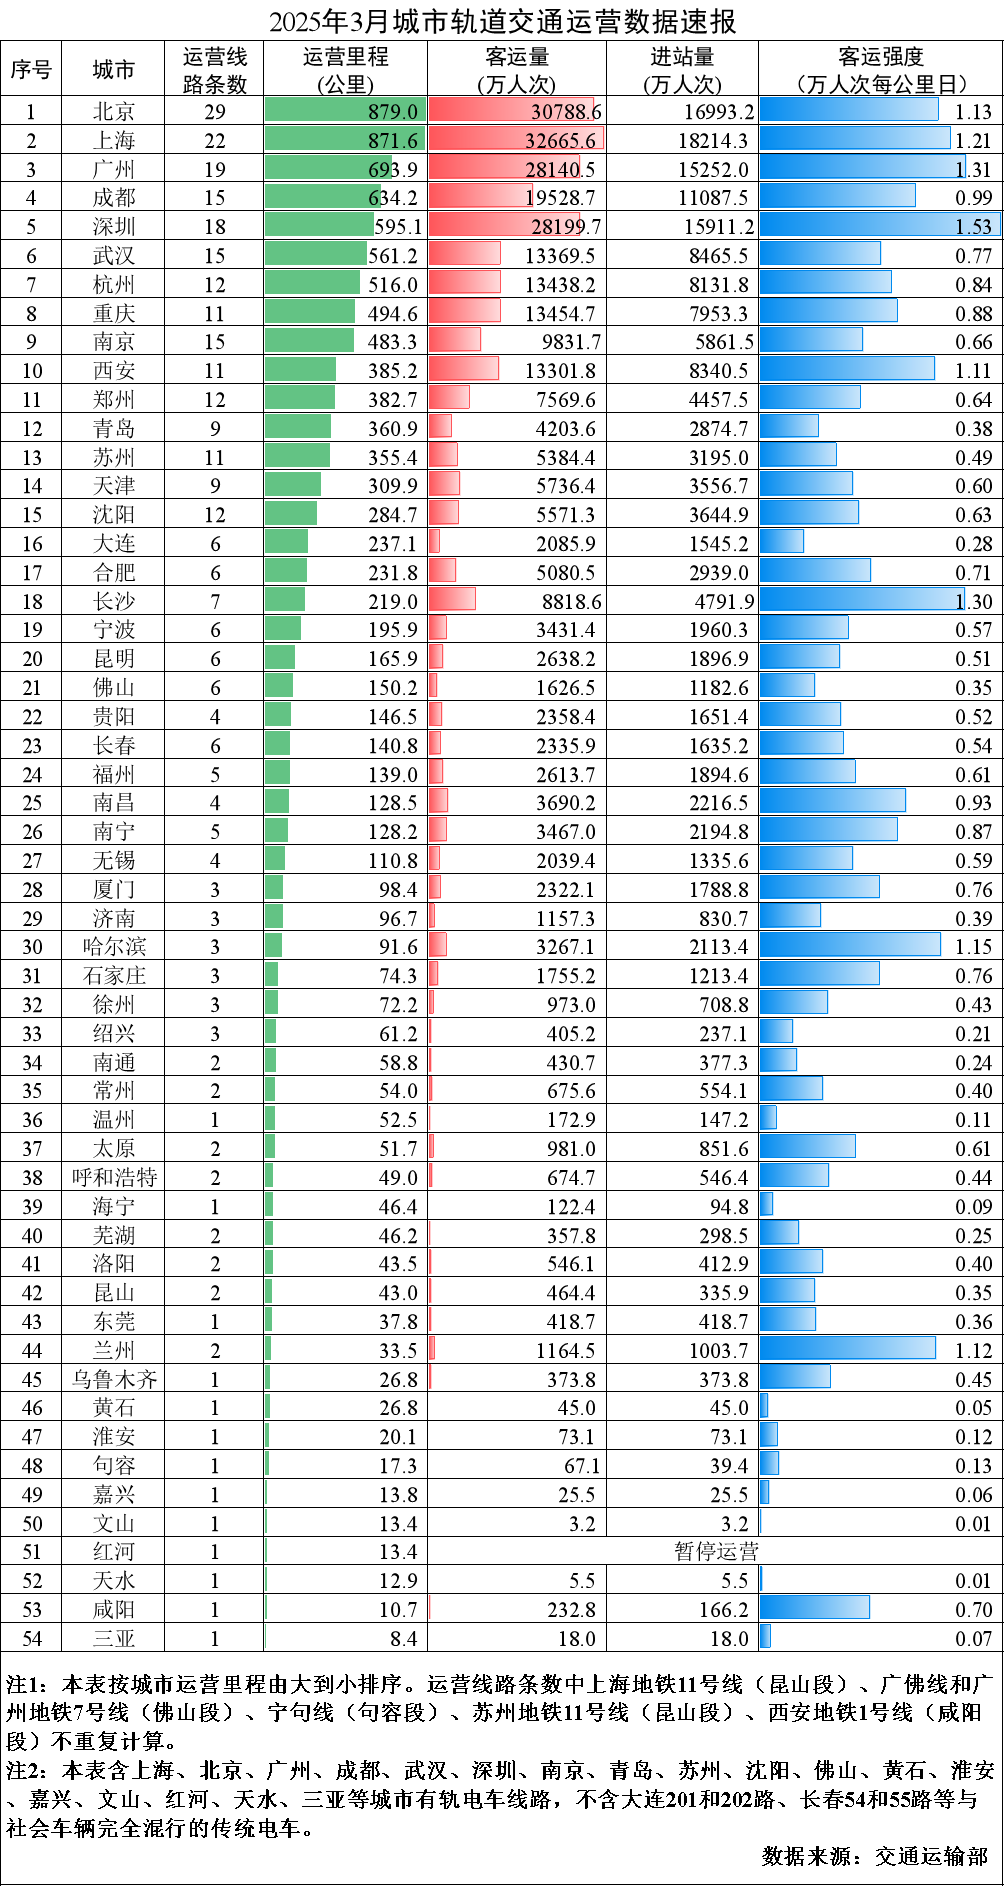
The Ministry of Transport recently released the operational data report of urban rail transit in March 2025: In March 2025, a total of 326 urban rail transit lines were in operation in 54 cities across 31 provinces (autonomous regions, municipalities directly under the Central Government) and the Xinjiang Production and Construction Corps. The operational mileage reached 10,975.8 kilometers, with a total of 3.64 million train trips actually operated, and the passenger volume was 288 million person-times, and the number of inbound passengers was 172 million person-times. In March, the passenger volume increased by 48 million person-times compared with the previous month, representing a growth of 20.0%, and increased by 8 million person-times compared with the same period last year, representing a growth of 2.9%. The average passenger intensity of the total operational mileage nationwide in February was 8,470 person-times per kilometer per day, increasing by 8.3% compared with the previous month and decreasing by 4.3% compared with the same period last year. There were no newly opened lines this month.
Among them, 268 subway and light rail lines were in operation in 43 cities, with an operational mileage of 9,507.8 kilometers, a passenger volume of 278 million person-times, and the number of inbound passengers was 165 million person-times. In 16 cities, 25 monorail, maglev, and urban rapid rail transit lines were in operation, with an operational mileage of 970.7 kilometers, a passenger volume of 88.03 million person-times, and the number of inbound passengers was 58.88 million person-times. In 18 cities, 33 tram and automated guideway transit lines were in operation, with an operational mileage of 497.3 kilometers, a passenger volume of 10.71 million person-times, and the number of inbound passengers was 10.15 million person-times.
China Metro Data Table
Please wait while the data is being loaded.
Related
评论
目前还没有评论。